TL;DR
When collecting enough samples from latency measurements taken
- From within the browser with WebSockets by using JavaScript
- And on the server side by measuring the RTT on the incoming TCP/IP handshake
it is possible for a website to infer that the visitor is using a proxy/VPN if those two latency measurements differ significantly.
Introduction
Premise: I am the owner of a hosted website and I have full control of my server (root rights). My server is not behind a load balancer or some other mechanism that prevents me from hooking into the incoming TCP/IP stream.
Goal: For each visitor of my site, I want to detect whether some tunneling protocol such as a proxy server (socks, https, ...) or a VPN service is being used. Why? Because a lot of spammers and scrapers use proxies and VPN's to hide their true IP address from websites.
Visually:
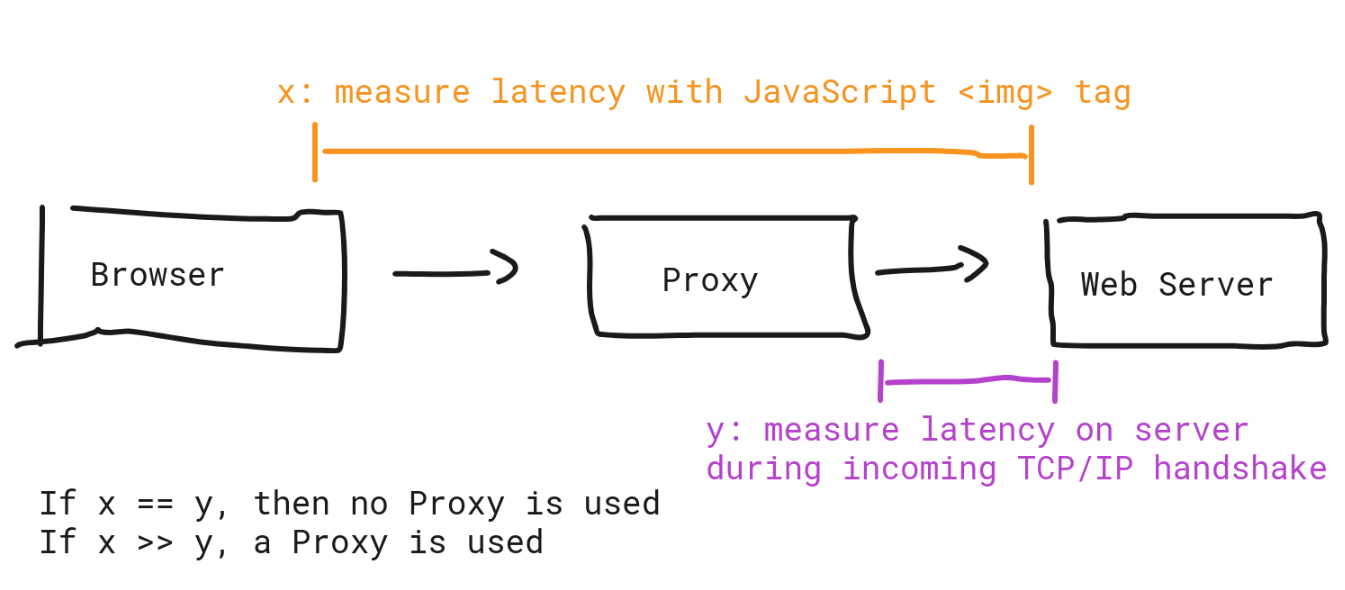
Put differently, I want to take two latency measurements and compare them.
- Latency from browser -> web server, measured with JavaScript from the browser
- Latency from external IP -> web server, measured on incoming TCP/IP handshake
The idea is very simple: A proxy server between browser and web server has the effect that the TCP/IP connection is split in half and two TCP/IP streams are created as a result. Only the latter TCP/IP stream (and it's source IP address) is then directly communicating to my server. My conjecture is: It's possible to measure significant timing differences between browser -> web server and external IP -> web server.
First Idea: Browser Latency with XMLHttpRequest
Good resources regarding latency measurement with the DOM and JavaScript:
- Analyzing Network Characteristics Using JavaScript And The DOM
- Measure network latency (time to first byte) from the client with JavaScript
Without much explanation, this is the JavaScript source code to obtain the latency from browser to web server I created in a first attempt. I collect 10 measurements and I use the median value.
let N = 10;

function ping(url) {
  return new Promise((resolve, reject) => {
    var started = performance.now();
    var http = new XMLHttpRequest();

    var cacheBuster = '?bust=' + (new Date()).getTime()
    url += cacheBuster;

    http.open("GET", url, /*async*/true);
    http.onreadystatechange = function() {
      if (http.readyState == 4) {
        var ended = performance.now();
        var milliseconds = ended - started;
        resolve(milliseconds);
      }
    };
    try {
      http.send(null);
    } catch(exception) {
      // this is expected
    }
  })
}

(async () => {
  let promises = [];
  for (var i=0; i <= N; i++) {
    promises.push(ping("https://incolumitas.com"));
  }
  Promise.all(promises).then((results) => {
    results.sort((a, b) => a - b);
    let median = null;
    let m1 = Math.floor(results.length / 2);
    let m2 = Math.ceil(results.length / 2);
    if (results.length % 2 == 0) {
      median = (results[m1] + results[m2]) / 2;
    } else {
      median = results[m1];
    }
    console.log('median', median);
    console.log('measurements', results);
  });
})()
The above code gives me the following result on incolumitas.com:
median 126.5
measurements [41.5, 91.5, 108.70000000298023, 121.19999999925494, 124.89999999850988, 126.5, 126.70000000298023, 130.09999999776483, 130.19999999925494, 145.10000000149012, 145.5]
However, there is a big problem. Using the XMLHttpRequest API to measure latencies gives wrong results. A substantial part of the latency does not come from the round trip time, but from browser networking internal things such as
- Resource Scheduling
- Queueing
- Connection start such as stalling, DNS lookup (negligible), initial connection, SSL
What we really want is the Waiting (TTFB) part. See the image below taken from the Dev Console network tab:
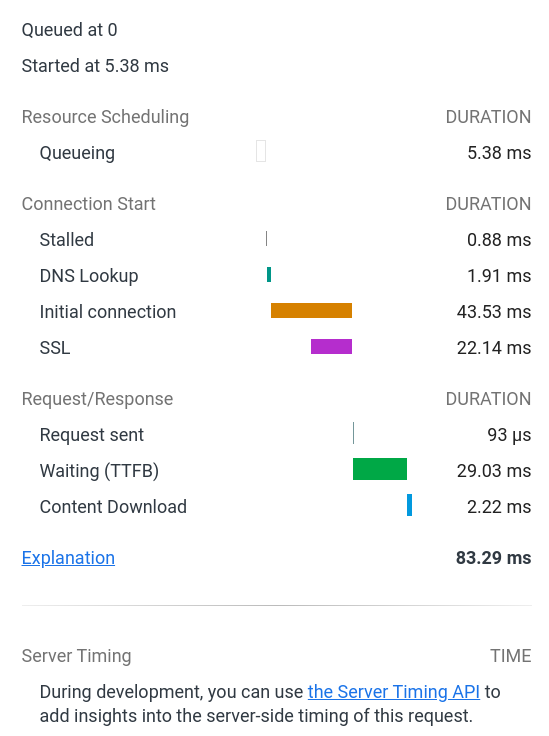
For that reason, the XMLHttpRequest technique is not very promising and I need to look for a more accurate technique to measure latencies in the browser.
Second Idea: Browser Latency with WebSockets
Upon realizing the latency measurements problems with the XMLHttpRequest technique from above, it's time to try out WebSockets in order to get more accurate latency (RTT) measurements with JavaScript.
I am not interested in the WebSocket connection establishment latency, I only want the latency between socket.send() and socket.onmessage() functions. All my WebSocket server does, is to send the message back. It's a simple echo server. On each socket.send(), I send the performance.now() relative timestamp to the server. That way, I can interpolate the latency when the server replies with a copy of the message.
The good thing with WebSockets: There is zero incentive to delay or stall WebSocket messages once the connection is established. This gives me accurate latency measurements.
This is the WebSocket latency measurement code and here is a link to the live test site: https://bot.incolumitas.com/ws-latency.html.
<!doctype html>

<html>
  <head>
    <meta charset = "utf-8">
    <title>WebSocket Latency Check</title>
    <meta name ="description" content="fu">
    <meta name ="author" content="NT">
  </head>

  <body>
    <pre id="data"></pre>
    <script>
      function roundToTwo(num) {
        return +(Math.round(num + "e+2")  + "e-2");
      }

      function getLatencyWebSocket() {
        return new Promise(function (resolve, reject) {
          function median(values){
            if (values.length ===0) return 0;
            values.sort(function(a,b){
              return a-b;
            });
            var half = Math.floor(values.length / 2);
            if (values.length % 2)
              return values[half];
            return (values[half - 1] + values[half]) / 2.0;
          }

          // Create a Web Socket
          const socket = new WebSocket('wss://abs.incolumitas.com:5555/');

          socket.onerror = function (err) {
            reject(err.toString());
          }

          var messages = [];
          const latencies = [];

          socket.onopen = function () {
            socket.send(JSON.stringify({
              type: 'ws-latency',
              ts: roundToTwo(performance.now()),
            }));
          }

          socket.onmessage = function (event) {
            messages.push(JSON.parse(event.data));
            if (messages.length <= 5) {
              socket.send(JSON.stringify({
                type: 'ws-latency',
                ts: roundToTwo(performance.now()),
              }));
            } else {
              for (let i = 0; i < messages.length - 1; i++) {
                latencies.push(roundToTwo(messages[i+1].ts - messages[i].ts));
              }
              resolve(median(latencies));
            }
          }
        });
        }

      getLatencyWebSocket().then((median) => {
        document.getElementById('data').innerHTML = median;
      });
    </script>
  </body>
</html>
For example, when I access the above code with my own browser, I will get a latency of 23.6ms.
Those are very promising results. WebSockets don't suffer from internal queuing and stalling issues such as the XMLHttpRequest object. This gives us much more accurate data to work with. WebSockets are designed to support real-time networking applications, so the latency should be similar to the latency that we can measure on an incoming TCP/IP handshake.
Idea: If the latencies between the TCP/IP handshake and the WebSocket messages don't match with a very low margin of error, then there is likely a tunnel or proxy in between.
Obtain External IP -> Web Server Latency with TCP/IP handshake RTT
This is a bit more complex, because I have to hook into the raw TCP/IP handshake. Without much explanation, the Python script below does the job:
from pypacker import ppcap
from pypacker.layer12 import ethernet
from pypacker.layer12 import linuxcc
from pypacker.layer3 import ip
from pypacker.layer4 import tcp
from pypacker.layer4 import ssl
from pypacker import pypacker
import pcapy
import getopt
import time
import sys
import traceback
import signal
import json

classify = False
interface = None
verbose = False
rtts = {}

def updateFile():
  print('writing RTTs.json with {} objects...'.format(len(rtts)))
  with open('RTTs2.json', 'w') as fp:
    json.dump(rtts, fp, indent=2, sort_keys=False)


def signal_handler(sig, frame):
  updateFile()
  sys.exit(0)

signal.signal(signal.SIGINT, signal_handler) # ctlr + c
signal.signal(signal.SIGTSTP, signal_handler) # ctlr + z


def tcpProcess(pkt, layer, ts):
  """
  Understand this: https://www.keycdn.com/support/tcp-flags

  from src -> dst, SYN
  from dst -> src, SYN-ACK
  from src -> dst, ACK

  I want the time between SYN-ACK and first ACK

  And then I want to record the
  """
  ip4 = pkt.upper_layer
  tcp1 = pkt.upper_layer.upper_layer

  # SYN (1 bit): Synchronize sequence numbers. Only the first packet sent from each
  # end should have this flag set. Some other flags and fields change meaning
  # based on this flag, and some are only valid when it is set, and others when it is clear.
  if tcp1.flags:
    label = ''
    key = '%s:%s' % (pkt[ip.IP].src_s, pkt[tcp.TCP].sport)

    if key not in rtts:
      rtts[key] = {}
    if (tcp1.flags & tcp.TH_SYN) and not (tcp1.flags & tcp.TH_ACK):
      label = 'SYN'
      if not label in rtts[key]:
        rtts[key][label] = time.time()
    if (tcp1.flags & tcp.TH_ACK) and not (tcp1.flags & tcp.TH_SYN):
      label = 'ACK'
      if 'SYN+ACK' in rtts[key] and 'ACK' not in rtts[key]:
        rtts[key][label] = time.time()
    if (tcp1.flags & tcp.TH_SYN) and (tcp1.flags & tcp.TH_ACK):
      key = '%s:%s' % (pkt[ip.IP].dst_s, pkt[tcp.TCP].dport)
      label = 'SYN+ACK'
      if key in rtts and not label in rtts[key]:
        rtts[key][label] = time.time()

    if key in rtts and "SYN+ACK" in rtts[key] and "ACK" in rtts[key] and not 'RTT' in rtts[key]:
      rtts[key]['RTT'] = '%sms' % round(((rtts[key]["ACK"] - rtts[key]["SYN+ACK"]) * 1000), 2)
      rtts[key]['RTT2'] = round(rtts[key]["ACK"] - rtts[key]["SYN+ACK"], 4)
      print("TCP Handshake - %s:%s -> %s:%s [%s], RTT=%s" % (pkt[ip.IP].src_s, pkt[tcp.TCP].sport,
          pkt[ip.IP].dst_s, pkt[tcp.TCP].dport, label, rtts[key]['RTT']))

      if len(rtts) > 0 and len(rtts) % 13 == 0:
        updateFile()


def usage():
  print("""
    -i, --interface   interface to listen to; example: -i eth0
    -l, --log         log file to write output to; example -l output.txt (not implemented yet)
    -v, --verbose     verbose logging, mostly just telling you where/what we're doing, not recommended if want to parse output typically""")


def main():
  logger = pypacker.logging.getLogger("pypacker")
  pypacker.logger.setLevel(pypacker.logging.ERROR)
  counter = 0
  print('listening on interface {}'.format(interface))

  try:
    preader = pcapy.open_live(interface, 65536, False, 1)
    preader.setfilter('tcp port 80 or tcp port 443')
  except Exception as e:
    print(e, end='\n', flush=True)
    sys.exit(1)

  while True:
    try:
      counter = counter + 1
      (header, buf) = preader.next()
      ts = header.getts()[0]

      tcpPacket = False
      pkt = None
      layer = None

      # try to determine what type of packets we have, there is the chance that 0x800
      # may be in the spot we're checking, may want to add better testing in future
      eth = ethernet.Ethernet(buf)
      if hex(eth.type) == '0x800':
        layer = 'eth'
        pkt = eth

        if (eth[ethernet.Ethernet, ip.IP, tcp.TCP] is not None):
          tcpPacket = True

      lcc = linuxcc.LinuxCC(buf)
      if hex(lcc.type) == '0x800':
        layer = 'lcc'
        pkt = lcc

        if (lcc[linuxcc.LinuxCC, ip.IP, tcp.TCP] is not None):
          tcpPacket = True

      if tcpPacket and pkt and layer:
        tcpProcess(pkt, layer, ts)

    except (KeyboardInterrupt, SystemExit):
      raise
    except Exception as e:
      error_string = traceback.format_exc()
      print(str(error_string))

try:
  opts, args = getopt.getopt(sys.argv[1:], "i:v:c:", ['interface=', 'verbose'])
  proceed = False

  for opt, val in opts:
    if opt in ('-i', '--interface'):
      interface = val
      proceed = True
    if opt in ('-v', '--verbose'):
      verbose = True

  if (__name__ == '__main__') and proceed:
    main()
  else:
    print('Need to provide a pcap to read in or an interface to watch', end='\n', flush=True)
    usage()
except getopt.error:
  usage()
Save the above script on your server as lat.py and run it with:
python lat.py -i eth0
My RTT measurement tool will produce output as listed below. The sample was taken from someone from South America visiting my blog:
1623092439: 192.123.255.204:65238 -> 167.99.241.135:443 [ACK], RTT=231.72ms
1623092439: 192.123.255.204:65237 -> 167.99.241.135:443 [ACK], RTT=239.88ms
1623092439: 192.123.255.204:65240 -> 167.99.241.135:443 [ACK], RTT=239.9ms
...
Testing the XMLHttpRequest Latency Technique
I will visit the following detection test site: https://bot.incolumitas.com/latency.html twice:
- Once with my normal browser without any proxy
- The second time with a scraping service that uses a proxy
And on the server side, I will let my TCP/IP latency measurement tool running.
First, I will test latencies with my own browser without using any proxy.
Latencies recorded from the TCP/IP handshake:
1623144210: 84.151.230.146:33724 -> 167.99.241.135:443 [ACK], RTT=15.79ms
1623144211: 84.151.230.146:33726 -> 167.99.241.135:443 [ACK], RTT=23.87ms
1623144211: 84.151.230.146:33728 -> 167.99.241.135:443 [ACK], RTT=15.82ms
1623144211: 84.151.230.146:33732 -> 167.99.241.135:443 [ACK], RTT=15.53ms
...
Latencies recorded from the browser with JavaScript
{
  "median": 136.4,
  "measurements": [109.9, 116.2, 124.8, 134.4, 134.6, 136.4, 165, 175, 181.5, 190.5, 196]
}
And now I will visit my test site with a scraping service.
Latencies recorded from the TCP/IP handshake:
1623144996: 24.125.86.142:56938 -> 167.99.241.135:443 [ACK], RTT=127.85ms
1623144997: 24.125.86.142:55420 -> 167.99.241.135:443 [ACK], RTT=183.9ms
1623144997: 24.125.86.142:47526 -> 167.99.241.135:443 [ACK], RTT=136.08ms
...
Latencies recorded from the browser with JavaScript
{
  "median": 1147.83,
  "measurements": [871.23, 977.15, 979.31, 1012.47, 1034.18, 1147.83, 1190.57, 1229.74, 1276.93, 1287.49, 1318.97]
}
Those are the results when considering the median values:
| RTT TCP Handshake | RTT XMLHttpRequest | Uses a Proxy |
|---|---|---|
| 23 | 136 | No |
| 125 | 1034 | Yes |
Those are definitely not enough samples. I needed to record real world samples with people all over the world
running the XMLHttpRequest technique script.
After having collected enough samples from real world users visiting my website, I can definitely say that the XMLHttpRequest technique to measure latencies is way too inaccurate. Therefore, the test site https://bot.incolumitas.com/latency.html is not usable to detect tunnels such as Proxies or VPN's.
Reason: Modern browsers simply add too much unpredictable stalling and delays to XMLHttpRequest requests, therefore it's impossible to compare those samples to RTT's measured in the TCP/IP handshake.
Testing the WebSocket Latency Technique
The data collection method was as follows: I let the TCP/IP handshake python script from above run on my server. At the same time, I am recording the latency of five WebSocket messages with the WebSocket technique from above. Then I consider the median values from the five WebSocket latency measurements and the median value from the TCP/IP handshake latency.
Below are the latency samples from 11 (probably) real persons visiting my website on a Sunday afternoon:
| RTT TCP Handshake | RTT WebSocket | Difference in % | Uses a Proxy |
|---|---|---|---|
| 79.83ms | 86ms | 7.7% | No |
| 191ms | 189ms | 1.05% | No |
| 175.8ms | 178ms | 1.2% | No |
| 239.7ms | 237ms | 1.1% | No |
| 40.1ms | 41ms | 2.2% | No |
| 135.9ms | 134.9ms | 0.7% | No |
| 116.0ms | 104ms | 11.5% | No |
| 47ms | 48ms | 2.1% | No |
| 135.9ms | 133ms | 2.1% | No |
| 64ms | 62ms | 3.2% | No |
| 207.9ms | 236.7ms | 13.8% | No |
As you can see, the difference between WebSocket latency and TCP/IP handshake is in most cases marginal. I assume that those visitors didn't use any proxy.
Obviously, I cannot say for sure, because after all, I want to find a way to detect proxy usage. But I am quite confident that they don't use proxies, because their browsing behavior appears to be organic and most my visitors don't use proxies (except on bot.incolumitas.com).
Now it's time to collect samples from some scraping providers (such as Brightdata or ScrapingBee) and see how the latencies differ there. With those providers, I am very confident that they use proxies, so my hypothesis is the following: The latancies from the WebSocket messages should be significantly larger then the ones from the TCP Handshake.
| Proxy Provider | RTT TCP Handshake | RTT WebSocket | Difference in % | Uses a Proxy |
|---|---|---|---|---|
| Brightdata | 135.8ms | 231ms | 70% | Yes |
| Brightdata | 122.3ms | 228ms | 86% | Yes |
| Brightdata | 103.9ms | 210ms | 102% | Yes |
| Brightdata | 151.1ms | 224ms | 48% | Yes |
| Brightdata | 128ms | 198ms | 54% | Yes |
| Brightdata | 121.85ms | 240ms | 96% | Yes |
| ScrapingBee | 191.9ms | 278.7ms | 45% | Yes |
| ScrapingBee | 143.7ms | 291ms | 103% | Yes |
| ScrapingBee | 149.9ms | 354.4ms | 136% | Yes |
| ScrapingBee | 95.7ms | 174.3ms | 83% | Yes |
| ScrapingBee | 147.9ms | 293.3ms | 98% | Yes |
| ScrapingBee | 95.7ms | 177.3ms | 86% | Yes |
The samples above confirm my hypothesis.
Indeed, the WebSocket latencies are at between 45% to 136% larger then their corresponding TCP handshake latencies. That is a significant difference compared to the largest difference of the No Proxy measurements from above (13.6%). Statistically speaking, we can determine with high probablity if the visiting user is using a proxy or not. Mission accomplished!
Some things to keep in mind:
- Sometimes, the latencies obtained from WebSockets have outliers. I assume that this is due to packet loss and re-transmission (WebSockets is a reliable protocol).
- The downside with TCP/IP handshake RTTs is that there may also occur packet loss and thus skewed latency measurements. But because there are usually a couple of TCP/IP handshakes made when a browser visits my website, I can take the median value as well.