Introduction
I in this blog post, I am investigating the current state of high precision JavaScript timers. High precision timing techniques were mostly required to launch CPU-level cache attacks such as Spectre and Meltdown from within the browser with JavaScript. However, I am not interested in cache attacks, I need high precision JavaScript timing techniques mostly to detect proxies and VPN usage via side channel analysis.
However, those papers mentioned above are deeply amazing. I do not think that it get's much better in the field of IT Security. The sheer human creativity demonstrated by finding those cache and CPU-level attack vectors is simply outstanding. I highly recommand you to read those papers (Also the Platypus paper on power side-channel attacks).
Firefox and Google Chrome reduced the precision of performance.now() significantly:
- Google Chrome reduced the
performance.now()precision to 100 microseconds (100µsor0.1ms) - Firefox reduced the
performance.now()precision even more to 1000 microseconds (1000µsor1ms)
Those bastards!
As mentioned, high precision timers are used to launch side-channel and timing attacks. In recent years, low level vulnerabilities such as Spectre, Meltdown, Rowhammer emerged. They all have in common that the attacker needs the ability to take high resolution time measurements.
The awesome Google Security Blog explains on the Spectre Proof-Of-Concept website why:
Before we run the Spectre proof of concept, we need a way to observe the side-effects of the transient execution. The most popular one is a cache side channel. By timing a memory access, we can infer if a chosen address is in the cache (if the access is fast) or needs to be loaded from memory (if the access is slow). Later, we will use a Spectre gadget to access a JavaScript array using a secret value as the index. Testing which array index got cached will allow us to recover that secret value.
So I learned that:
- Timing memory accesses reveals if a chosen address is in the cache or not
- A fast memory access means that the accessed address is cached
- A slow memory access means that the accessed address needs to be loaded from the memory
- In order to measure the tiny difference in access times, we need high-precision JavaScript timers
And then they go on...
To be able to measure these small timing differences we need a high-precision timer. There is a great paper on this topic by Michael Schwarz, Clémentine Maurice, Daniel Gruss, and Stefan Mangard: "Fantastic Timers and Where to Find Them: High-Resolution Microarchitectural Attacks in JavaScript". One example they show is the use of a SharedArrayBuffer as a monotonic clock: increment a counter in a worker thread and read it from a second thread as a high precision timestamp. SharedArrayBuffers in particular are nowadays only available if the site is cross-origin isolated but there are many more timers described in that paper.
Unfortunately, the SharedArrayBuffer is no longer allowed by default. MDN says about SharedArrayBuffer:
Shared memory and high-resolution timers were effectively disabled at the start of 2018 in light of Spectre.
and if you still want to use SharedArrayBuffer, you will need to do the following:
As a baseline requirement, your document needs to be in a secure context. For top-level documents, two headers will need to be set to cross-origin isolate your site:
Cross-Origin-Opener-Policywithsame-originas value (protects your origin from attackers) andCross-Origin-Embedder-Policywithrequire-corpas value (protects victims from your origin)
So my next idea is to try to make use of the other high precision timers presented in the paper cited above: Fantastic Timers and Where to Find Them: High-Resolution Microarchitectural Attacks in JavaScript.
Do the proposed techniques from early 2017 still work? In the next sections, I am going to test some of the techniques presented by the authors.
All tests were conducted on Ubuntu 18.04 with the Chromium 95.0.4638.69 browser.
Base precision of performance.now()
My setup:
$ chromium-browser --version

Chromium 95.0.4638.69 Built on Ubuntu , running on Ubuntu 18.04
First of all, I want to confirm that the precision/resolution of performance.now() is really 100µs or 0.1ms on Chromium 95.0.4638.69.
This is accomplished by the below JavaScript snippet. I am collecting 10.000 performance.now() samples in a for-loop and I look how many unique samples are among those 10.000 collected samples, which gives me the precision.
'use strict';
// The performance.now() method returns a DOMHighResTimeStamp, measured in milliseconds.
var samples = [];
var t0 = performance.now();

for (var i = 0; i < 10000; i++) {
  samples.push(performance.now());
}

var t1 = performance.now();

let diff1 = t1 - t0;
let diff2 = samples[samples.length - 1] - samples[0];

console.log('#1 Elapsed measured by performance.now(): ' + diff1 + 'ms');
console.log('#2 Elapsed measured by collected samples: ' + diff2 + 'ms');

console.log('Number of samples: ' + samples.length);
let s = new Set(samples);
console.log('Number of unique samples / measuring steps: ' + s.size);

console.log('Granularity/Precision #1 of performance.now(): ' + diff1 / s.size + 'ms');
console.log('Granularity/Precision #2 of performance.now(): ' + diff2 / s.size + 'ms');
As expected, the precision is almost exactly 100µs or 0.1ms.
#1 Elapsed measured by performance.now(): 15.20000000006985ms
#2 Elapsed measured by collected samples: 15.20000000006985ms
Number of samples: 10000
Number of unique samples / measuring steps: 146
Granularity/Precision #1 of performance.now(): 0.10410958904157432ms
Granularity/Precision #2 of performance.now(): 0.10410958904157432ms
If you invoke performance.now() repeatedly in a while loop until you obtain a new timer value from performance.now() and you increment a counter until that point, then the value of the counter is considered the edge size of the timer resolution.
(function edgeSize() {
  var counter = 0;
  var next, last = performance.now();

  while((next = performance.now()) == last) {
    counter++;
  }

  console.log(counter);
})()
Put differently, the granularity of the performance.now() resolution can be measured in terms of increments of the counter variable. The counter is reset as soon as a new performance.now() is observed.
Building a Timer by (ab)using Web Workers
JavaScript's concurrency model is based on a single-threaded event loop. Multithreading was introduced into JavaScript with web workers, which run in parallel and have their own event loop.
Here, I am creating an implicit timer by attempting to abuse web workers to derive highly accurate timestamps. Put differently, we throw performance.now() into the trash and create our own timer!
Or more nuanced: We create a web worker thread and let it monotonically increase a counter and consider it an approximation of a real timer.
But the Fantastic Timers Paper lists some caveats:
Web workers cannot post messages to other web workers (including themselves). They can only post messages to the main thread and web workers they spawn, so called sub workers. Posting messages to the main thread again blocks the main thread’s event loop, leaving sub web workers as the only viable option.
Live Example of High-Precision Web Worker Timer
And this is how our implicit timer works:
-
If the worker receives a message from the main thread, it sends back its current counter value.
-
Otherwise, the worker continuously requests the current counter value from the sub worker.
-
The sub worker increments the counter on each request and sends the current value back to the worker.
And in code:
web_worker_timer.html:
<html>
  <head></head>
  <body>
    <script>
      var ts = new Worker('subworker.js');
      var elapsed = null;

      function counter(e) {
        var count = e.data;
        if (count > 0) {
          document.write('Counter: ' + count + '<br>');
          let precision = elapsed / count;
          document.write('Precision: ' + precision + ' ms<br>');
        }
      }

      ts.addEventListener('message', counter);

      var t0 = performance.now()
      ts.postMessage(0);

      // setTimeout() acts as a method that
      // we want to time
      setTimeout(function() {
        ts.postMessage(0);
        elapsed = (performance.now() - t0);
        document.write('Elapsed Time: ' + elapsed + '<br>');
      }, 1000)
    </script>
  </body>
</html>
subworker.js:
var sub = new Worker('subworker2.js');

sub.postMessage(0);

var count = 0;

sub.onmessage = msg;
onmessage = msg;

function msg(event) {
  if (event.data != 0) {
    count = event.data;
    sub.postMessage(0);
  } else {
    self.postMessage(count);
  }
}
subworker2.js:
var count = 0;

onmessage = function(event) {
  count++;
  postMessage(count);
}
But what is the precision I am able to obtain with the above method?
Elapsed Time: 1000.2000000001863
Counter: 10844
Precision: 0.09223533751384971 ms
So this is bad news. I only manage to obtain the same precision as performance.now() gives us. Fail!
The authors from the Fantastic Timers Paper claim that the achieved resolution is up to 15 μs. I only manage to get around 90µs - 100µs with my somewhat old laptop from 2014.
However, on browserstack.com, when using a real device, I manage to get results around 40µs / 50µs, thus beating performance.now()
Elapsed Time: 1041.89999
Counter: 19083
Precision: 0.0545 ms
Therefore, with fast devices, the claimed 15 μs is probably realistic!
Recovering the high resolution of performance.now() with clock interpolation
Live Example of Clock Interpolation
The Fantastic Timers Paper claims in section [3.1 Recovering a high resolution]:
As the underlying clock source has a high resolution, the difference between two clock edges varies only as much as the underlying clock. This property gives us a very accurate time base to build upon. As the time between two edges is always constant, we interpolate the time between them.
The idea is as follows:
When repeatedly invoking performance.now() in a while loop, we get the same results from the performance.now() invocation for a certain amount of time. As long as performance.now() yields the same number, we increment a counter. When we get a new value from performance.now(), we reset the counter.
The code below takes n=20 samples:
for (var i=0; i < 20; i++) {
  var counter = 0;
  var next, last = performance.now();

  while((next = performance.now()) == last) {
    counter++;
  }

  console.log(next, counter);
}
and yields the following output on my machine/browser:
5063.5999999996275 4
5063.799999998882 13
5063.89999999851 5
5064.299999998882 11
5064.799999998882 35
5064.89999999851 4
5065.0999999996275 54
5065.199999999255 2
5065.39999999851 33
5065.5 8
5065.699999999255 32
5065.799999998882 4
5066 42
5066.0999999996275 19
5066.199999999255 3
5066.39999999851 42
5066.5999999996275 66
5066.799999998882 6
5066.89999999851 29
5067 15
What does the above output tell me?
Sometimes edges are 0.2ms apart, sometimes 0.3ms and sometimes just 0.1ms.
In some cases edges are even 0.5ms apart:
5064.299999998882 11
5064.799999998882 35
However, isn't our assumption that larger edges also have larger counter values?
Let's collect some statistical significant data.
var samples = [];
var stats = {};

for (var i=0; i < 1000; i++) {
  var counter = 0;
  var next, last = performance.now();

  while((next = performance.now()) == last) {
    counter++;
  }

  samples.push([last, next, counter]);
}

for (let sample of samples) {
  var delta = (sample[1] - sample[0]).toFixed(2);
  if (!stats[delta]) {
    stats[delta] = [sample[2]]
  } else {
    stats[delta].push(sample[2])
  }
}

console.log(stats)
When invoking the code above, I don't find that larger edges have large counter values.
I get quite weird results:
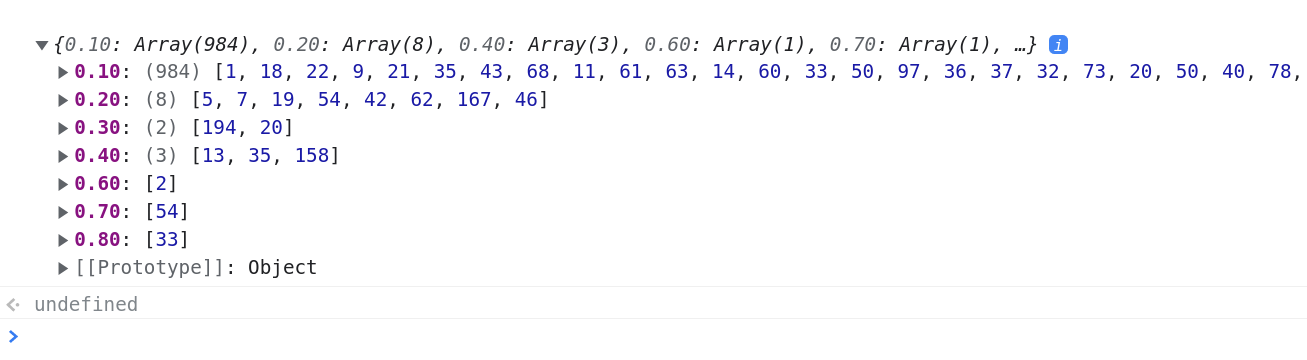
Are the counter values larger and more stable on different machines with different CPUs? I am only testing on my very old laptop from 2014. Maybe this has a large influence.
Indeed, when testing on browserstack with macOS Big Sur and the latest Safari browser:
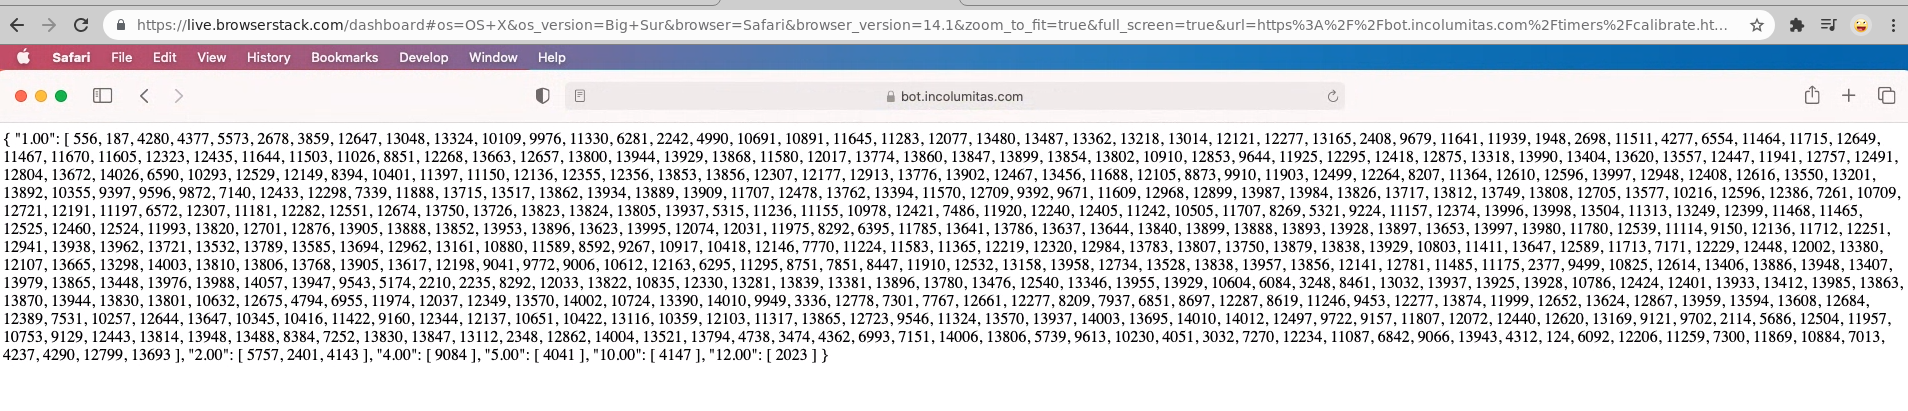
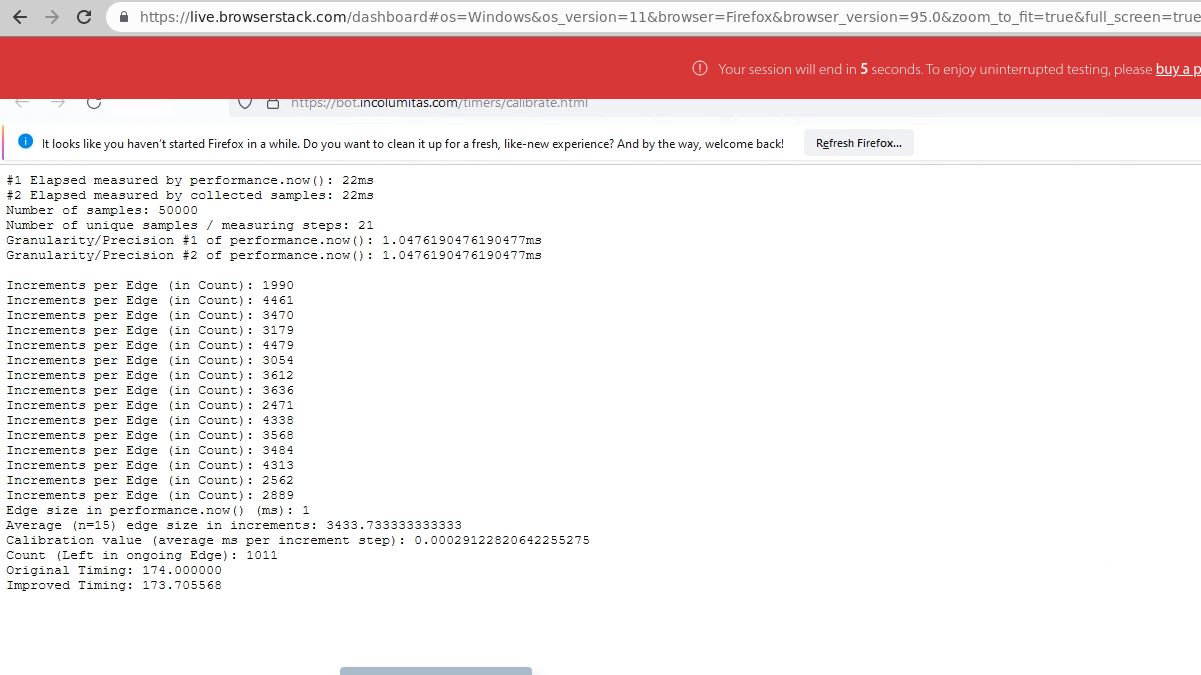
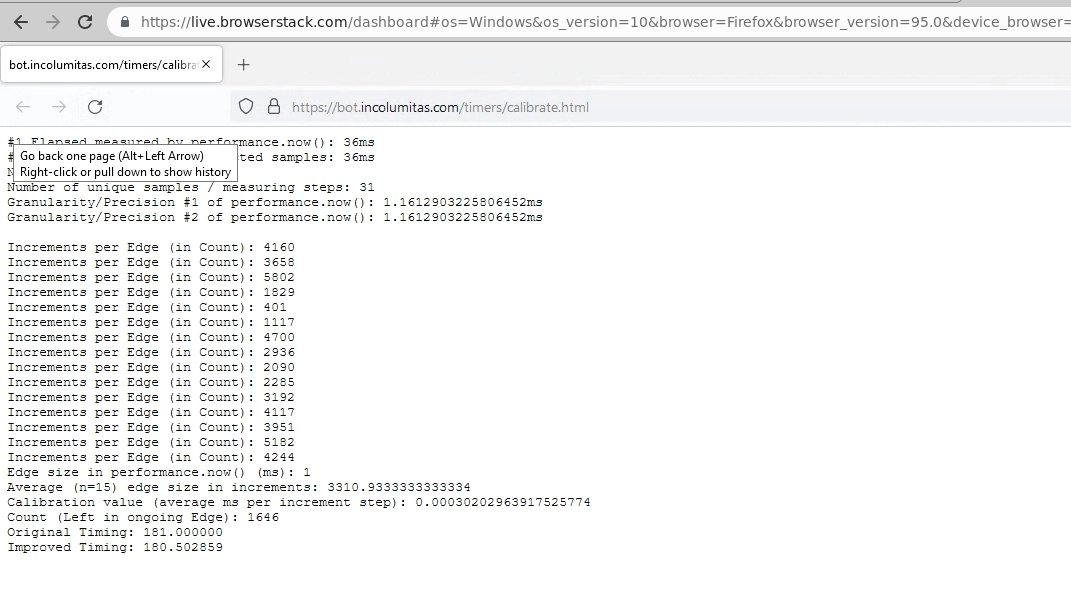
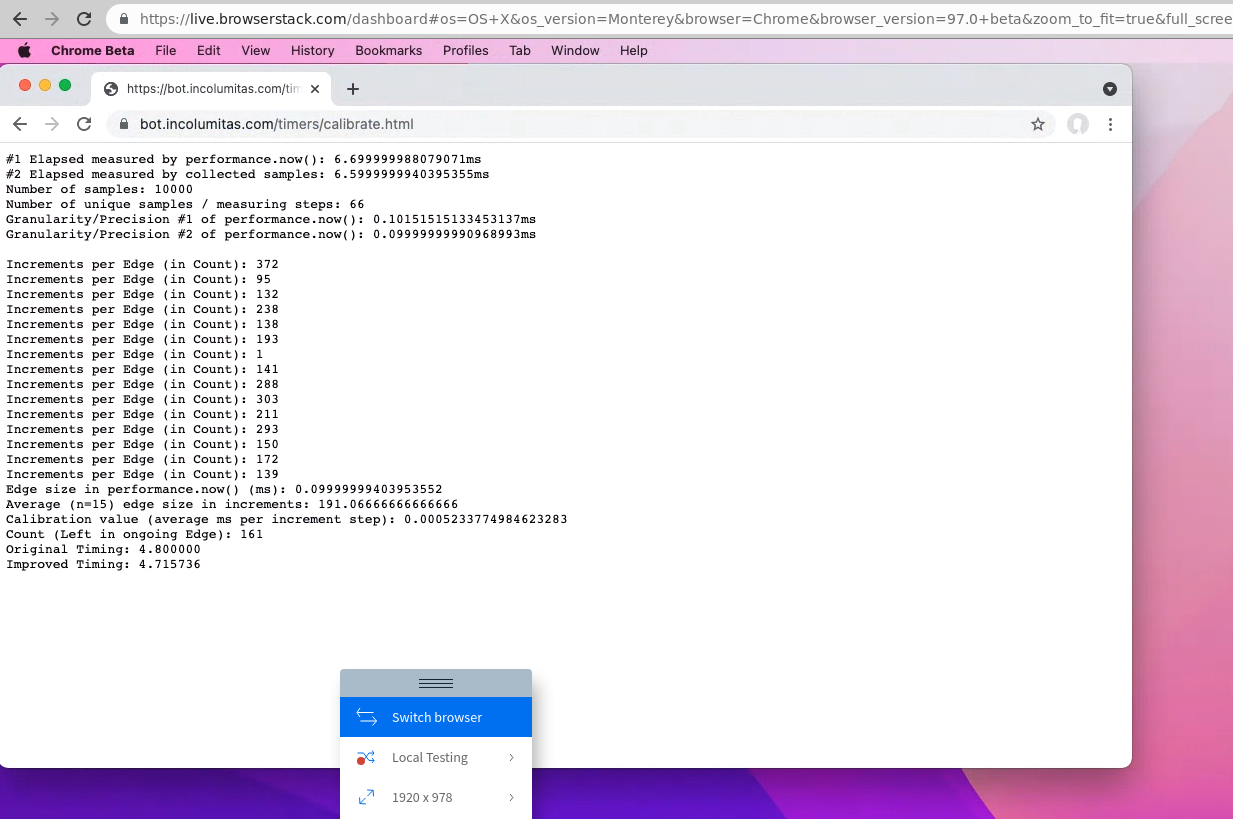
So it has to be noted: Clock interpolation is highly dependent on OS and CPU! The faster the device, the larger the counter values and the more accurate the interpolation.
This is the clock interpolation algorithm proposition from Fantastic Timers Paper.
You can also find the live example here: Live Example of Clock Interpolation
<html>
<head></head>
<body>
<pre id="output"></pre>
<script>
function write(text) {
document.getElementById('output').innerText += text + '\n';
}
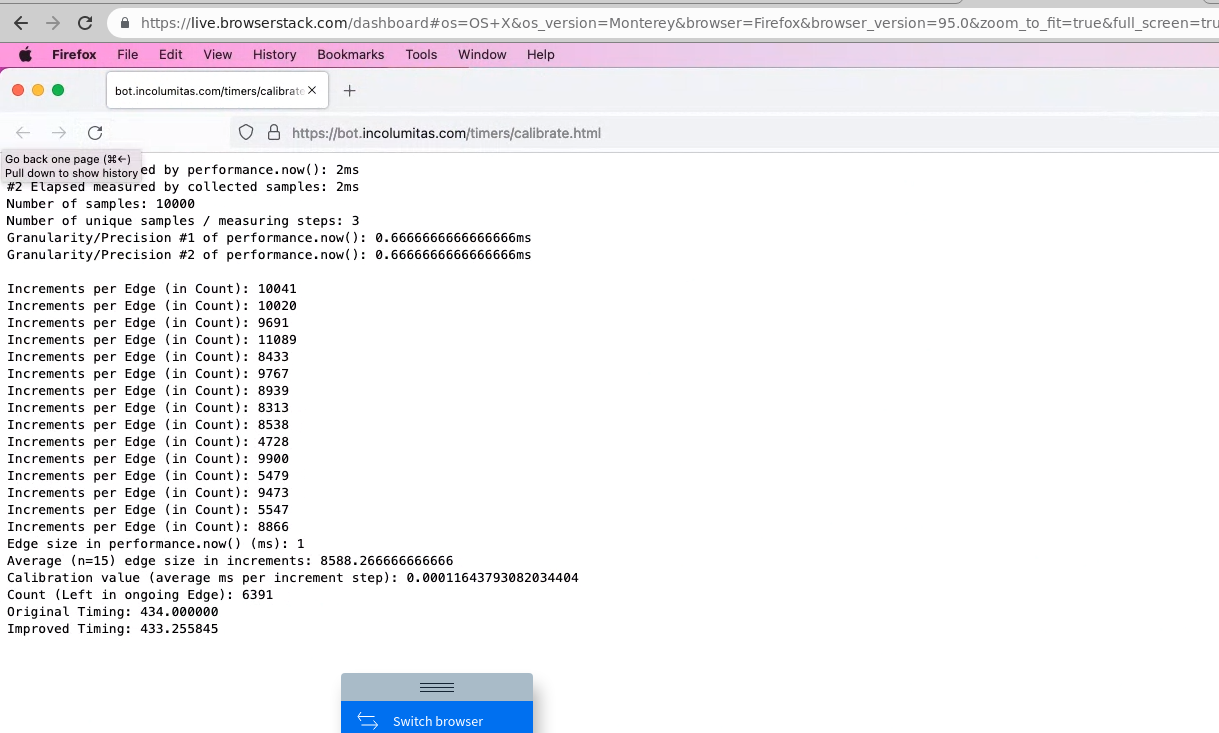
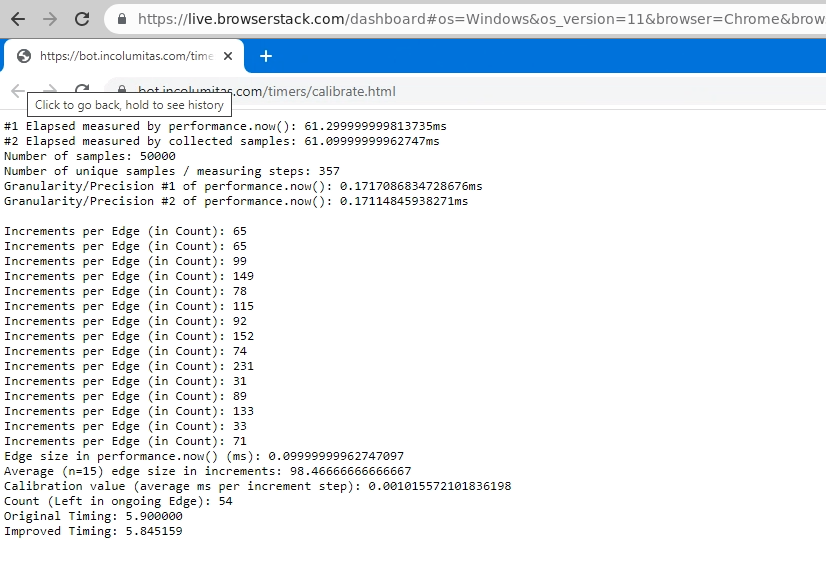
function calibrate() {
var N = 15;
var counter = 0, next;
var count = 0;
for (var i = 0; i < N; i++) {
next = wait_edge();
count = count_edge();
counter += count;
write('Increments per Edge (in Count): ' + count );
}
next = wait_edge();
var d1 = wait_edge() - next;
var d2 = counter / N;
var calibrated = d1 / d2;
write('Edge size in performance.now() (ms): ' + d1 );
write('Average (n=' + N + ') edge size in increments: ' + d2 );
write('Calibration value (average ms per increment step): ' + calibrated );
return calibrated;
}
function wait_edge() {
var next, last = performance.now();
while((next = performance.now()) == last) {
}
return next;
}
function count_edge() {
var last = performance.now(), count = 0;
while (performance.now() == last) {
count++;
}
return count;
}
var sleep = function(ms) {
return new Promise(resolve => setTimeout(resolve, ms));
}
async function measure() {
var start = wait_edge();
// some heavy math that takes some time
for (var k = 0; k < 1000000; k++) {
var q = Math.log10(Math.pow(k) * Math.atan2(k) * Math.sqrt(k));
}
var count = count_edge();
var t1 = performance.now();
var elapsed = (t1 - start) - count * calibrate();
write('Count (Left in ongoing Edge): ' + count );
write('Original Timing: ' + (t1 - start).toFixed(6));
write('Improved Timing: ' + elapsed.toFixed(6));
}
function measurePrecision() {
// The performance.now() method returns a DOMHighResTimeStamp, measured in milliseconds.
var samples = [];
var t0 = performance.now();
for (var i = 0; i < 10000; i++) {
samples.push(performance.now());
}
var t1 = performance.now();
let diff1 = t1 - t0;
let diff2 = samples[samples.length - 1] - samples[0];
write('#1 Elapsed measured by performance.now(): ' + diff1 + 'ms' );
write('#2 Elapsed measured by collected samples: ' + diff2 + 'ms' );
write('Number of samples: ' + samples.length );
let s = new Set(samples);
write('Number of unique samples / measuring steps: ' + s.size );
write('Granularity/Precision #1 of performance.now(): ' + diff1 / s.size + 'ms' );
write('Granularity/Precision #2 of performance.now(): ' + diff2 / s.size + 'ms');
write('');
}
measurePrecision();
setTimeout(measure, 1000);
</script>
</body>
</html>
To be honest, I have some issues with their proposed calibration function:
function calibrate() {
  var counter = 0, next;

  for (var i = 0; i < 10; i++) {
    next = wait_edge();
    counter += count_edge();
  }

  next = wait_edge();

  return (wait_edge() - next) / (counter / 10.0);
}
As I have shown above, there is no clear correlation between performance.now() gap size and the
counter steps. In the function calibrate() they collect the edge size in counter steps for 10 samples and then they calibrate by
return (wait_edge() - next) / (counter / 10.0);
by dividing the size of one edge in terms of performance.now() millieseconds by the average edge size in terms of counter values (N=10).
I have some issues with that approach:
- It seems to me that the
countervalue for eachperformance.now()step is rather unpredictable. It's probably dependent on page load, JavaScript execution, overall processor load and so on. - We invoke
calibrate()after the function that we want to time? Who says that suddenly there is less load on JavaScript and we obtain larger counter values than during function execution?
But still, I think clock interpolation gives us better resolution than performance.now().
What do we gain in resolution?
This is how a function with clock interpolation is measured:
async function measure() {
  var start = wait_edge();

  // some heavy math that takes some time
  for (var k = 0; k < 10000000; k++) {
    var q = Math.log10(Math.pow(k) * Math.atan2(k) * Math.sqrt(k));
  }

  var count = count_edge();
  var t1 = performance.now();

  var elapsed = (t1 - start) - count * calibrate();

  document.write('Count (Left in ongoing Edge): ' + count + '<br>');
  document.write('Original Timing: ' + (t1 - start).toFixed(6) + '<br>');
  document.write('Improved Timing: ' + elapsed.toFixed(6) + '<br>');
}
So the idea is actually the following:
The execution time of the function is measured with the variabales start and t1. Both are variables populated from performance.now().
However, before the t1 measurement is taken, it has to be waited until a new edge is reached (var count = count_edge();). We are now right at the start of a new edge. count holds the number of increments that were left in the ongoing edge.
Then the elapsed time t1 - start is decreased by count * calibrate().
Multiplying calibrate() with count basically translates count into millieseconds, and this amount of millieseconds can be subtracted from the elapsed time to obtain a higher resolution timestamp.
Clock interpolation on different OS' and machines
I am using browserstack to conduct my experiments. I am using real devices to visit my Live Page of Clock Interpolation.
Win 11 with Chrome 97
Win 11 with Firefox 95
Win 10 with Firefox 95
macOS Montery with Chrome 97
macOS Montery with Firefox 95