Abstract. botstop.io tells you whether your browser looks like a bot, and it now shows every signal it looks at. This article documents the two newest groups of signals. The first group is 19 ways in which a web page can tell an automated or headless Chrome from a normal one. I found them by running 30,217 web-platform-tests in four differently started Chromes and keeping what was stable in each and different between two; almost every difference is traced to its cause, which is a DevTools protocol domain, a launch switch or a difference between Chrome and its headless builds. The second group does not ask the browser anything. It measures the machine: how long a fragment shader takes, whether 96 KB fit into the L1 data cache, and which sign the FPU gives a NaN. On eleven days of real sign-ins (1,535 page views, 153 of them from paying customers) the first version of these hardware probes flagged 29% of the page views of paying customers. The version that survived flags none of them and still fires for 51% of the refused sign-up attempts. I list everything that did not survive, because that list is the more useful half.
Contents: Two questions · The setting · Part I: automation signals · Part II: the hardware · Part III: real traffic · Versions · Limitations · Conclusion · References
Two questions
In August I put botstop.io online and wrote that I would not spell out its checks, because that would only help the people who write the bots. Since the end of October the page does the opposite. It lists every signal, the value it saw in your browser and a paragraph on what that value means, and its header carries a version number, v12.0 as I write this.
I changed my mind for two reasons. A benchmark that hides what it measures is of little use: nobody can improve a bot, or a detector, against a score without a breakdown. And the signals I trust most by now are the ones that do not need to be secret. If a page measures that your "NVIDIA GeForce RTX 3060" needs 180 ms for something a graphics card does in 2 ms, knowing the limit does not help you. You need the card.
A page that wants to know what it is talking to can ask two different questions:
- Is a program driving this browser? Part I answers it for Chrome, with signals that come out of a test suite and not out of my head.
- Is the machine what the browser says it is? Part II answers it with timing side channels, which is the unfinished business of a post I started in January 2021, Browser Red Pills: Why are you browsing my website from AWS Lambda?. Its first line still says that it is not finished.
Part III holds both against real traffic. That is where I learned the most, mainly about my own first attempt.
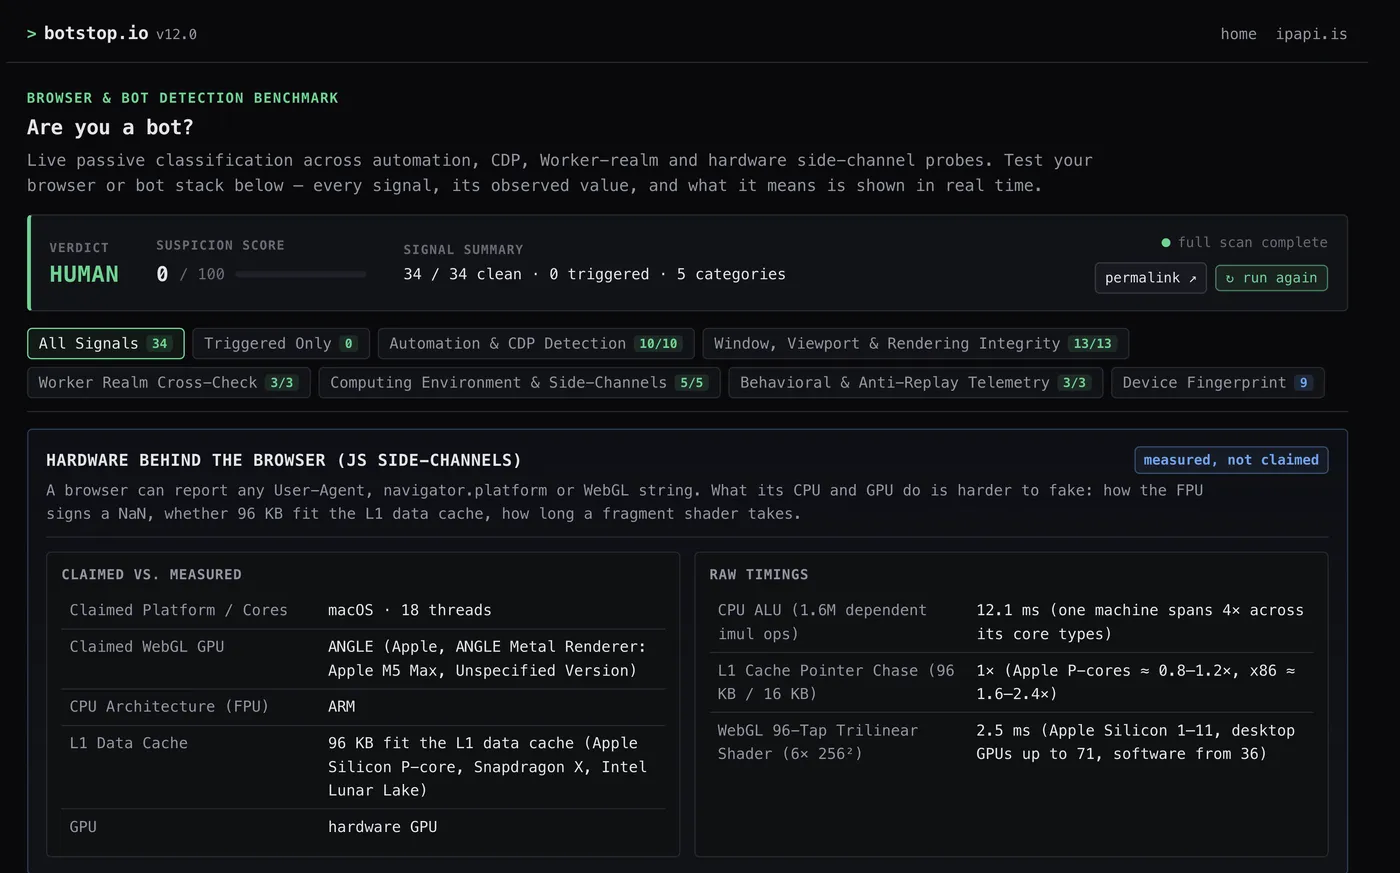
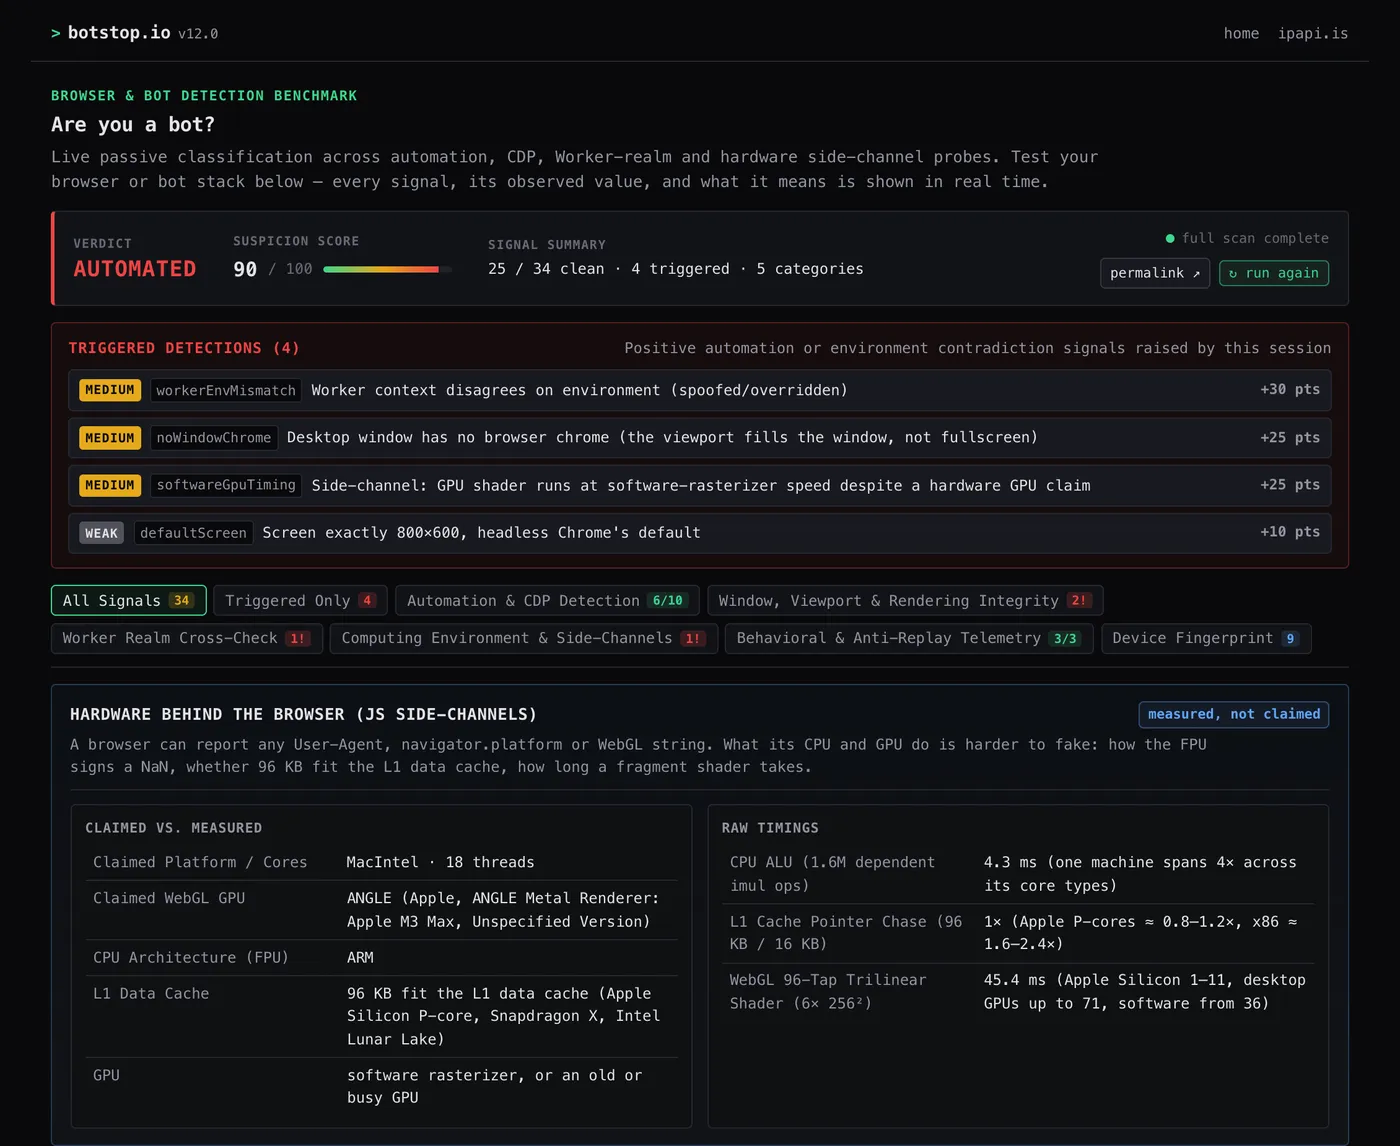
navigator.webdriver, a clean User-Agent) and a WebGL string that says "Apple M3 Max" while SwiftShader does the rendering. The shader needs 45 ms.The setting
Who is on the other side. What signs up to a service like ipapi.is today is rarely a script that speaks HTTP. It is a real Chrome on a rented server, started and steered by a program through the Chrome DevTools Protocol (CDP), usually with Puppeteer or Playwright or something built on them, and usually behind a proxy. It runs my JavaScript like any other browser. Its operator controls everything the browser says about itself: the User-Agent, navigator.webdriver, the WebGL renderer string, the number of cores. Anti-detect browsers patch those answers into the C++ of the browser, where no JavaScript can see the patch.
What a page has. JavaScript, the answers it gets, and a clock. The clock is coarse on purpose. After the cache attacks of the last decade [1] [2], performance.now() ticks in steps of 100 µs in Chrome [3], and in Firefox and Safari my data contains almost nothing but whole milliseconds. I wrote about these clocks five years ago. Everything in Part II has to live with them, and with a budget: the probes run once per page view on the main thread and take about 50 ms on my laptop.
The detector. botstop.io is a thin page around a library that also guards the sign-up and login forms of ipapi.is. A collector script gathers the signals and sends them along in a sealed envelope; a classifier on the server adds up weights. One strong signal, or 45 points, makes a visitor automated; 18 points make it suspicious. A signal with weight 0 is recorded and shown, but not scored. That last category matters a lot below: it is how a new signal gets measured before it is allowed to hurt anybody.
The data. Three sources, and each can show different things.
- Lab. Chromes that I started myself, so I know what they are. Good for finding signals and for checking that known bots are caught. Says nothing about false positives.
- Sign-ins at ipapi.is, 30 October to 10 November 2026: 1,535 snapshots that carry the hardware probes, each from one view of the sign-up, login or activation page. 153 are from accounts that have paid; I treat those as people. 1,086 are from other sign-ins that the service accepted: mostly people, with bots among them. 296 are attempts that it refused: mostly bots, with people among them. This last label is partly circular, because the classifier under test had a say in the refusal. So I use the refused group to see whether a signal separates at all, and I only trust the paying customers for a number. The audience is technical: 53% Windows, 29% macOS and 6% each for Linux, iOS and Android; 69% Chrome, 11% Firefox, 11% Edge, 8% Safari.
- Checks on botstop.io, same days: 1,102. This is not a sample of anything. 431 of them (39%) come from one fleet of stealth browsers that visits in bursts several times a day. It makes a fine specimen, and it gets its own section.
Everything below is counts and timings. No address, account or fingerprint appears in this article. The hardware probes sort machines into a handful of classes (ARM or x86, which cache, GPU or no GPU) and are far too noisy to recognize one machine among others of its class.
Part I: Is a program driving this Chrome?
hHunter: let the test suite have the ideas
A page cannot see the DevTools protocol. It can only notice that the browser does something differently while a client is attached, or because of how it was started. The usual ways to find such a difference are to read Chromium's source, or to stumble over one. I wanted a method that finds differences without my having an idea first.
Browser vendors maintain the largest existing collection of "observe something from inside a page and compare it with what should happen": the web-platform-tests (WPT), tens of thousands of pages that each check one behavior and report PASS or FAIL per subtest [4]. If a test passes in a normal Chrome and fails in an automated one, it has observed, from inside a page, something that tells the two apart. It is a detection signal that somebody else wrote for me.
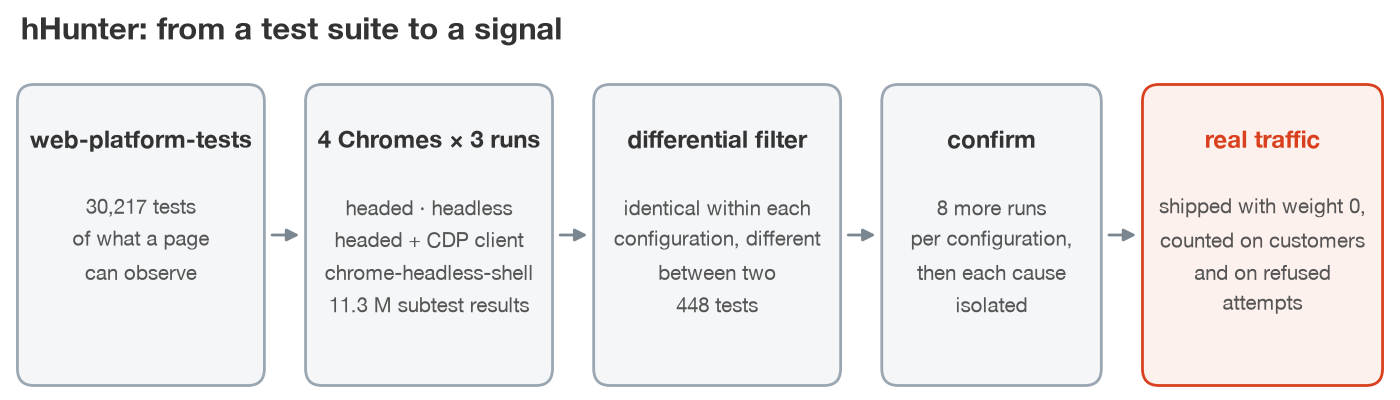
hHunter (headless hunter) is the harness I built around that thought. It runs the same tests in four Chromes:
| configuration | browser | isolates |
|---|---|---|
normal |
Chrome with a window, nothing attached | the baseline |
headless |
the same binary with --headless |
the new headless mode |
cdp |
Chrome with a window and a CDP client attached the way Puppeteer attaches | an automation client |
shell |
chrome-headless-shell of the same version |
the old headless mode, Playwright's default |
Each configuration runs every test several times. A result that is identical in all repeats of each configuration and differs between two of them is a candidate.
A few details decide whether the result means anything:
- No WebDriver. WPT's own runner drives the browser over WebDriver, which would make every configuration an automated one. Here an ordinary web page opens each test in a fresh top-level window and collects the result, so the only difference between configurations is the browser. In the
cdpconfigurationnavigator.webdriveris masked with--disable-blink-features=AutomationControlled, as every stealth setup does it. What is left is what attaching itself changes. - Same order everywhere. The test list is shuffled per repeat, identically in every configuration. Whatever one test does to the next is then the same everywhere, and across repeats it shows up as instability and is dropped.
- Focus. On my Mac the first run reported that headless Chrome always has focus and headed Chrome does not. It was my windows that were not in front. On Linux every headed browser gets an X server of its own.
- Own probes in the same format. Three pages of mine report about 170 passive values (navigator, screen, media queries, permission states, codecs, WebGL) as subtests named
key = value, so that a value that differs shows up in the same diff.
The run that produced most of what follows took place on a rented Linux server without a GPU, with Chrome 156.0.8078.79 and the chrome-headless-shell of the same version: 30,217 tests in 4 configurations, 3 repeats each, 11.3 million subtest results, 147 browser-hours. The 448 tests behind any finding then ran 8 more times in every configuration.
| compared with headed Chrome | after 3 repeats | after 8 more |
|---|---|---|
| headless | 21 flips, 27 timeouts | 14 flips, 1 timeout |
| CDP client | 14 flips, 152 timeouts | 6 flips, 13 timeouts |
| chrome-headless-shell | 146 flips, 137 timeouts | 113 flips, 98 timeouts |
A flip is a subtest that passes in one configuration and fails in the other, or a probe value that differs. A timeout is a test that reported in one and timed out in the other. The middle row is the first lesson of this article. 152 tests timed out only under the CDP client, in three out of three runs. Eight more runs left 13 such findings. On a busy server, a timeout is a statement about the server.
The first row is a result too, only a dull one: the new headless mode is the same binary as Chrome, and it behaves like it. Of its 14 flips, 13 are tests that need WebGL (below, H3), and on a Mac with a GPU nothing is left but what everybody knows: the 800×600 screen, the color depth, the HeadlessChrome token.
Every finding has one cause
"Differs under a CDP client" is not useful yet, because a client does many things at once. So the confirmed tests ran again in configurations that each switch on one part of the client: attaching alone, the Page domain, the Runtime domain, the Network domain, Puppeteer's isolated world, and Playwright's way of attaching pages at browser level. Every finding showed up with exactly one part of the client, and with no other:
| cause | what a page can see |
|---|---|
Runtime.enable |
C1 and C2 below |
Network.enable |
C3 |
| pages attached at browser level, as Playwright does | P1: a prerendered page never runs |
| attaching at all | new windows behave differently. Opening one needs a click, so this is of no use to a passive check |
I repeated the first row for this article with nothing but a WebSocket and a page that runs C1 and C2 in a loop and writes the result into its title (Chrome 157, with a window). Attaching changes nothing. Page.enable, Network.enable, Debugger.enable and Log.enable change nothing. Runtime.enable switches both signals on, and Runtime.disable switches both off again.
That table is also the map for evasion. The tools that avoid Runtime.enable [5] take out the first row. The other rows stay.
The 19 signals
| # | tells apart | what the page sees | cause | v12 |
|---|---|---|---|---|
| C1 | CDP client | an uncaught error from code compiled out of a string reaches window.onerror with an empty source URL |
Runtime.enable |
recorded |
| C2 | CDP client | console.debug(error) runs the page's Error.prepareStackTrace |
Runtime.enable |
recorded |
| C3 | CDP client | a same-origin frame's message arrives before the frame's load event |
Network.enable |
recorded |
| P1 | Playwright | a page it prerenders is fetched and never runs | pages attached at browser level | not used |
| V1 | Puppeteer, Playwright | Google Chrome without its 19 "Google …" speech voices | --disable-component-extensions-with-background-pages |
recorded |
| F1 | Puppeteer, Playwright | the 201st history-state change within 10 s is accepted | --disable-ipc-flooding-protection |
recorded |
| F2 | Playwright | Google Chrome without Widevine | --disable-component-update |
recorded |
| F3 | Puppeteer, Playwright | LanguageDetector.availability() says unavailable |
the OptimizationHints feature is switched off | recorded |
| F4 | Puppeteer | navigator.userAgentData.brands is empty |
page.setUserAgent() replaces the UA over CDP without client-hint metadata |
recorded |
| H2 | headless, Linux | (any-pointer: none): a desktop without a pointing device |
the headless platform has no input devices | 15 points |
| H3 | headless, no GPU | WebGL on SwiftShader although the page asked for failIfMajorPerformanceCaveat |
headless hands out software WebGL, headed Chrome refuses | 20 points |
| H4 | headless, Linux | the keyboard layout map has an IntlYen key |
a built-in layout instead of the X server's | recorded |
| S1 | headless shell | new URL('chrome-extension://x:0') keeps its port |
the shell does not register Chrome's own URL schemes | recorded |
| S2 | headless shell | SVG systemLanguage matches only the exact navigator.language |
no accept-languages preference | recorded |
| S3 | headless shell | the web app manifest is never fetched | no installability | not used |
| S4 | headless shell | performance.memory.jsHeapSizeLimit is rounded to three digits |
no site isolation, so Blink hides the exact value | recorded |
| S5 | headless shell, Linux | text in a web font measures exactly, without Chrome's fractional error | not traced | not used |
| S6 | headless shell | the page's icon is never fetched | there is no tab to show it in | recorded |
| S7 | headless shell | HeadlessChrome stays in userAgentData.brands and Sec-CH-UA behind a replaced UA string; no Accept-Language header |
--user-agent replaces the string and nothing else |
recorded |
"Recorded" means weight 0: shown on botstop.io as not scored, and counted in Part III. The causes in the launch-switch rows are not guesses: the switches are in the default arguments of Puppeteer 25.5 and Playwright 1.64. S6, S7 and F1 to F4 have been checked on macOS only so far.
Some of these deserve a closer look.
C1 and C2: a listener on the Runtime domain. Runtime.enable is the command that makes Chrome report execution contexts and console calls to a client. Almost every automation library sends it. With it enabled, an error thrown by code that was compiled from a string (eval, new Function, a string timer) arrives at window.onerror without the URL of the page:
// Resolves true while a DevTools Runtime session is attached.
function cdpAttached() {
  return new Promise((resolve) => {
    const prev = window.onerror;
    window.onerror = (msg, source) => {
      window.onerror = prev;
      resolve(source === '');
      return true;                       // swallowed: nothing in the console
    };
    setTimeout(() => eval('__hh_probe__'), 0);  // ReferenceError from eval'd code
  });
}
Line number, column and stack are unchanged; only the file name is dropped. The same happens in a dedicated Worker, which page-level stealth patches do not reach. C1 has been in the collector since September. WPT found it again as runtime-error-in-setTimeout.html.
C2 is the survivor of a famous trick. For years the way to detect Runtime.enable was an Error with a getter on stack, logged with console.debug: the inspector read the property to build a preview, and the getter ran. V8 stopped calling user getters during previews in May 2025, and the trick went silent, as Antoine Vastel described [6]. But to describe an error the inspector still formats its stack, and for that V8 calls the hook that pages may install:
function cdpAttachedViaPrepareStackTrace() {
  let hit = false;
  const prev = Error.prepareStackTrace;
  Error.prepareStackTrace = () => { hit = true; return ''; };
  console.debug(new Error());           // formatted only when someone listens
  Error.prepareStackTrace = prev;
  return hit;
}
This one is not mine alone: rebrowser's own bot detector checks the same hook [5]. I have not seen C1 or C3 described elsewhere, which may only mean that I have not looked in the right places.
A warning that applies to all three C signals: an open DevTools window is a CDP client too. So is an AI agent that drives a real person's own browser. "A client is attached" is not the same statement as "this is abuse", and that is one reason why these three carry no weight of their own.
C3: a message that overtakes a load event. A frame whose inline script posts a message to its parent: Chrome fires the frame's load event first and delivers the message after it. With the Network domain enabled, which Puppeteer and Playwright both do for every frame, the order flips. WPT found it as a Content Security Policy test that only passes when load comes first.
// Needs a same-origin page that is loaded over the network:
//   <!doctype html><script>parent.postMessage('frame', '*')</script>
function networkDomainEnabled(url = '/frame.html') {
  return new Promise((resolve) => {
    const frame = document.createElement('iframe');
    let order = '';
    const onMessage = (e) => { if (e.source === frame.contentWindow) order += 'm'; };
    addEventListener('message', onMessage);
    frame.onload = () => { order += 'l'; };
    frame.style.cssText = 'position:absolute;width:0;height:0;border:0;visibility:hidden';
    frame.src = url;
    document.body.append(frame);
    setTimeout(() => {
      removeEventListener('message', onMessage);
      frame.remove();
      resolve(order === 'ml');         // message first, load second
    }, 1500);
  });
}
It held in 8 of 8 runs on Linux and 3 of 3 on macOS with my own client, and with real Puppeteer and real Playwright in both headless builds. Stealth tools that avoid Runtime.enable usually still enable Network. I was rather proud of this one. Remember it when you get to Part III.
F1: a rate limit that automation switches off. Blink lets a frame change its history state 200 times in 10 seconds and drops the rest. Puppeteer and Playwright start Chrome with --disable-ipc-flooding-protection, which lifts the limit. So a page can count:
// Resolves the number of history-state changes the browser let through, of 201.
function stateChangesAccepted() {
  return new Promise((resolve) => {
    const frame = document.createElement('iframe');
    frame.style.cssText = 'position:absolute;width:0;height:0;border:0;visibility:hidden';
    frame.srcdoc = '';
    frame.onload = () => {
      const win = frame.contentWindow;
      let seen = 0;
      win.navigation.addEventListener('navigate', (e) => { seen++; e.preventDefault(); });
      for (let i = 0; i < 201 && seen === i; i++) win.history.replaceState(null, '');
      frame.remove();
      resolve(seen);                    // 200 in Chrome, 201 under Puppeteer and Playwright
    };
    document.body.append(frame);
  });
}
Two things have to be right. The budget belongs to the frame, and a frame that has spent it cannot navigate at all for the rest of the 10 seconds, so the probe needs a frame of its own. And the 200 accepted changes must not be committed, because some Chrome versions spend 20 ms on each; a navigate listener that cancels every change avoids that, and counting its calls is the measurement, since the limiter runs before the event. In a real Chrome the dropped call logs a console warning that names the switch. That is why this probe only runs on botstop.io's own page.
S4: a number that is too round. performance.memory.jsHeapSizeLimit is 4,395,630,592 in Chrome on both test machines and 3,760,000,000 in the shell. The round value is not the shell's limit. It is Blink hiding the real one: unless the renderer process is locked to one site, memory values are sorted into buckets of three significant digits, and the shell has no site isolation. Chrome 157 started with --disable-site-isolation-trials reports the same round number. An exact limit is a multiple of V8's 256 KiB pages and cannot be that round, so the test does not depend on the machine:
const limit = performance.memory.jsHeapSizeLimit;
const rounded = limit >= 1e6 && limit % 10 ** (String(limit).length - 3) === 0;
S6: nobody to show an icon to. Chrome fetches a page's icon for its tab once the load event has fired, and the fetch has a Resource Timing entry. The shell has no tab and never asks. The catch is that Chrome keeps icons in a database of its own and does not fetch one it knows, so on a second visit there is nothing to see. A #fragment on the icon URL is a new icon to that database and the same cached file to the network:
// Resolves true when the browser fetched the page's icon, false after the deadline.
function fetchedPageIcon() {
  return new Promise((resolve) => {
    const want = new Set();
    const observer = new PerformanceObserver((list) => {
      if (list.getEntries().some((e) => want.has(e.name))) { observer.disconnect(); resolve(true); }
    });
    observer.observe({ entryTypes: ['resource'] });
    const tag = '#' + Math.random().toString(36).slice(2, 8);
    for (const link of document.querySelectorAll('link[rel~="icon"]')) {
      if (!/^https?:/.test(link.href)) continue;
      link.href = link.href.split('#')[0] + tag;
      want.add(link.href);
    }
    const arm = () => setTimeout(() => resolve(false), 1500);
    if (document.readyState === 'complete') arm(); else addEventListener('load', arm);
  });
}
H3: a flag that headless ignores. On a machine without a GPU, headed Chrome gives a page no WebGL context at all. Headless Chrome hands one out on SwiftShader, even when the page asks for failIfMajorPerformanceCaveat: true, a flag that exists to refuse software rendering. 13 of the 14 confirmed headless findings are WPT tests that need WebGL and failed in the headed browser. The SwiftShader renderer string is a known tell; getting it despite that flag is the rarer part.
What did not hold up
- Most of the first pass. 152 CDP findings and 27 headless findings after three repeats, 13 and 1 after eight more.
- "Headless Chrome is always focused." My unfocused windows, see above.
- Prerendering under CDP. 68 prerender tests differed under the CDP client in the first pass, the largest cluster of the whole run. Eight repeats left 6. The cause was my own client, which attached pages the way Playwright does. That is P1, real, and specific to Playwright. It would cost every visitor an extra page load, so it is not in production.
- Idle deadlines.
requestIdleCallbackdeadlines looked longer in headless on the first run. On Linux the median is 15 ms in both. - S3, the manifest. The shell never fetches a page's web app manifest. Chrome in an Incognito window does not either, so every Incognito visitor would look like the shell. S6 is the same idea without that hole.
- Popups. Six tests around
window.openchange under any attached client. A page needs a click to open a window, so this cannot be checked passively.
Part II: Is the machine what the browser says it is?
Where the idea comes from
In 2014 Ho, Boneh, Ballard and Provos showed that a web page can tell whether its browser runs in a virtual machine [7]. Their red pills time two things: a baseline operation that takes the same time everywhere, and a differential operation that is slower in a VM. The ratio decides. They proposed six differential operations: writing to the console, local storage, spawning Web Workers, messaging between Workers, CPU–GPU communication through WebGL's readPixels, and heavy WebGL rendering.
In 2021 I tried five such operations against AWS Lambda and never finished the post. Its last chart is worth a look today: the WebGL operation took about 165 ms on my laptop and about 860 ms on Lambda, a clean separation. A third line in the same chart, labeled "phone", sits at 800 ms right next to Lambda. I plotted it and drew no conclusion from it. Five years later the same phone problem met me in production.
The research since then went the other way, towards identifying a device: DrawnApart fingerprints an individual GPU by the speed of its execution units [8]. Trampert, Rossow and Schwarz recover cache sizes, cache associativity and core counts in the browser, and from them the CPU vendor and often the model [9]. Schwarz, Lackner and Gruss detect the instruction set from the timing of JIT-compiled code [10]. The closest relative of what I need is older, Google's Picasso, which verifies the class of a device from how it renders a canvas [11].
My problem is narrower, and its constraints are tighter. I do not want to know which machine this is. I want to test one claim that a fleet makes in order to look normal, on a login page, with the stock clock, in a few dozen milliseconds, and with a false positive rate that I can defend to a paying customer.
The claims are easy to find. A browser in a datacenter usually has no GPU. Chrome then renders with SwiftShader, a software rasterizer, and says so in the WebGL renderer string. So the fleets overwrite the string, and the server becomes an "NVIDIA GeForce RTX 3060" or an "Apple M4 Max".
Probe 1: how long a fragment shader takes
precision highp float;
varying vec2 v;
uniform sampler2D t;      // 256×256 noise texture with mipmaps, trilinear filtering
uniform float u;
void main() {
  vec4 acc = vec4(0.0);
  vec2 uv = v + vec2(u);
  for (int i = 0; i < 96; i++) {
    acc = texture2D(t, uv, 1.5);                 // where to read next ...
    uv = fract(uv + acc.xy * 0.37 + 0.13);       // ... depends on what was read
  }
  gl_FragColor = vec4(acc.rgb, 0.25);
}
const t0 = performance.now();
for (let k = 1; k <= 6; k++) {                       // six blended passes over 256×256 pixels
  gl.uniform1f(uLoc, k * 0.11);
  gl.drawArrays(gl.TRIANGLE_STRIP, 0, 4);
}
gl.readPixels(0, 0, 256, 256, gl.RGBA, gl.UNSIGNED_BYTE, px);   // forces the GPU to finish
const gpuShaderMs = performance.now() - t0;
Every pixel makes 96 texture lookups, and each lookup's coordinates depend on the result of the one before, so nothing can be skipped or reordered. Six passes over 65,536 pixels are 37.7 million filtered lookups. A GPU has hardware for exactly this and is done in a few milliseconds. A software rasterizer does the same arithmetic on CPU cores.
On one machine the difference looks like this. The same Chrome 157 on my MacBook Pro needs 2.5 ms with the GPU and 45 ms when it is started with SwiftShader (medians of 85 and 80 runs; SwiftShader never got under 39.8 ms). That is a factor of 18, on a machine with 18 CPU cores for SwiftShader to use.
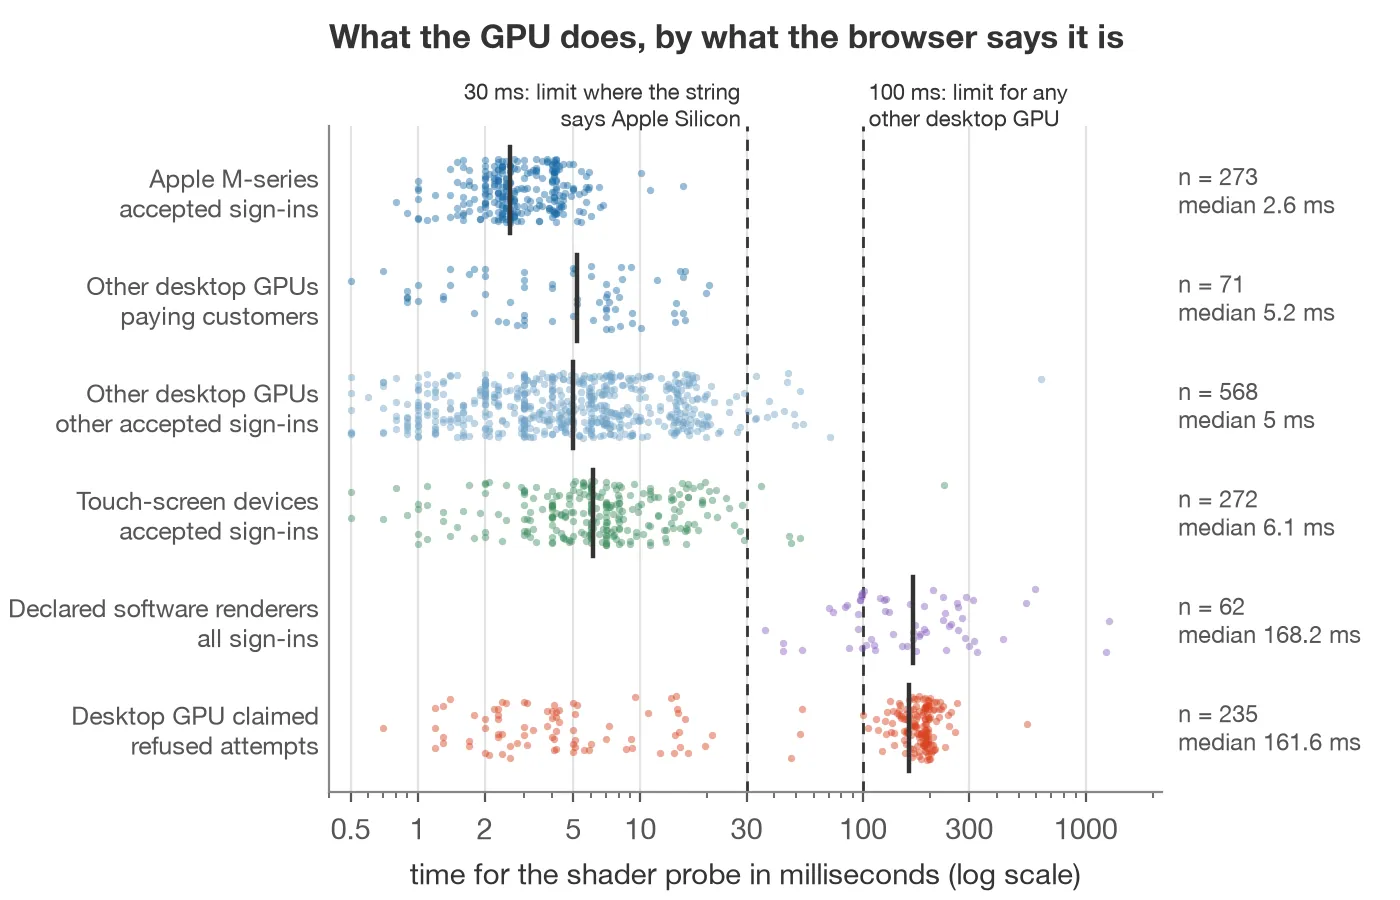
What Figure 3 says, row by row:
- Apple M-series, 273 sign-ins: median 2.6 ms. The slowest real Mac needed 11.1 ms. The one dot at 15.5 ms has an Apple M1 renderer string and a Windows User-Agent.
- Other desktop GPUs: 71 sign-ins of paying customers, all under 21 ms. Among 568 other accepted sign-ins the slowest machine I believe in needed 71 ms, an Intel HD Graphics that only speaks Direct3D 10.1, a chip from around 2011. The dot at 631 ms is an automated browser that opened an activation link and trips three other signals as well.
- Devices with a touch screen, 272, of which 148 are phones and tablets and 124 are laptops: mostly fast, but a phone with a PowerVR GE8100 needed 231 ms.
- Software renderers that say so, 62 (Microsoft's Basic Render Driver, SwiftShader, llvmpipe): 36 ms to 1.3 s, median 168 ms.
- Refused attempts that claim a desktop GPU, 235: two clouds. 83 stay under 100 ms, most of them far under. 152 take longer.
From this the rule in v12 follows. The signal fires when the renderer string names a hardware GPU, the device reports no touch screen, and the shader takes more than 100 ms, or more than 30 ms where the string says Apple Silicon. In both cases the shader must also be slow compared with a CPU loop that runs just before it (1.6 million integer multiplications), so that a machine on which everything is slow is not flagged. Phones, and with them everything else that has a touch screen, are not judged.
The second limit exists because of the 45 ms from above. SwiftShader on a fast CPU is quicker than the slowest honest GPU, so no single limit separates the two. The claim does: nothing that really is an Apple M-series chip needed more than 11.1 ms.
My first limit was 22 ms, for every device. Besides the automated browser it flagged 16 accepted sign-ins on real hardware: Intel HD Graphics of several generations, an Iris Xe, a GeForce GT 710, a GTX 1660 Ti at 49 ms that must have been busy with something else, the masked renderer strings of Brave and Firefox, and the PowerVR phone. On botstop.io it called a Samsung phone suspicious in 11 of its 12 visits, because its GPU needs 74 to 85 ms in Firefox. The phone from my 2021 chart sends its regards.
Probe 2: do 96 KB fit into the L1 data cache?
The second claim is "I am an Apple Silicon Mac". Apple's fast cores have an unusually large L1 data cache, 128 KB. x86 cores have 32 to 48 KB, which is no accident of the current models: the usual way to build an L1 cache ties its size to the page size, and x86 pages are 4 KB where Apple's are 16 KB. A cache size cannot be read from JavaScript, but it can be timed, as the work in [9] does at full scale with a timer built from a SharedArrayBuffer. I need two points and the ordinary clock:
function makeCycle(len, seed) {          // a random permutation that is one single cycle
  const a = new Int32Array(len);
  for (let k = 0; k < len; k++) a[k] = k;
  let sd = (seed | 1) >>> 0;
  for (let j = len - 1; j > 0; j--) {
    sd = Math.imul(sd ^ (sd >>> 15), 0x85ebca6b) >>> 0;
    const r = sd % j;
    const tmp = a[j]; a[j] = a[r]; a[r] = tmp;
  }
  return a;
}
function chase(a, steps, start) {        // every load waits for the one before it
  let k = start & 255;
  for (let m = 0; m < steps; m++) k = a[a[a[a[k]]]];
  return k;
}
const a16k = makeCycle(4096, s1);        // 16 KB of 32-bit integers
const a96k = makeCycle(24576, s2);       // 96 KB
// chase a16k in blocks of 500,000 steps until at least 10 ms have passed,
// chase a96k for the same number of blocks, and divide the two times
A pointer chase through a random cycle defeats the prefetcher, and since each load needs the result of the previous one, the latencies add up. Where both arrays fit into the L1 cache the two chases take the same time, and the ratio is 1. Where 96 KB do not fit, most loads have to go to the L2 cache (two of three with a 32 KB cache), and the ratio is about 2. The loop runs until 10 ms have passed, so that it also works with a clock that ticks in whole milliseconds.
| machine | engine | L1 data cache | ratio: 5% / median / 95% |
|---|---|---|---|
| MacBook Pro, Apple M5 Max, fast cores | V8 (Chrome 157) | 128 KB | 0.88 / 0.91 / 0.95 |
| the same Mac | SpiderMonkey (Firefox 159) | 128 KB | 0.83 / 0.92 / 1.10 |
| AMD EPYC (Zen 2), KVM guest | V8 (Node 18) | 32 KB | 1.89 / 1.91 / 1.93 |
| Intel Xeon (Skylake), KVM guest | V8 (Node 22) | 32 KB | 2.00 / 2.20 / 2.38 |
Real traffic agrees. Of 271 sign-ins from Apple Silicon Macs, 267 measure between 0.8 and 1.2. Of 557 from Windows and Linux desktops, nearly all of them x86, 511 measure 1.65 or more, with a median of 1.92 (Figure 4, left).
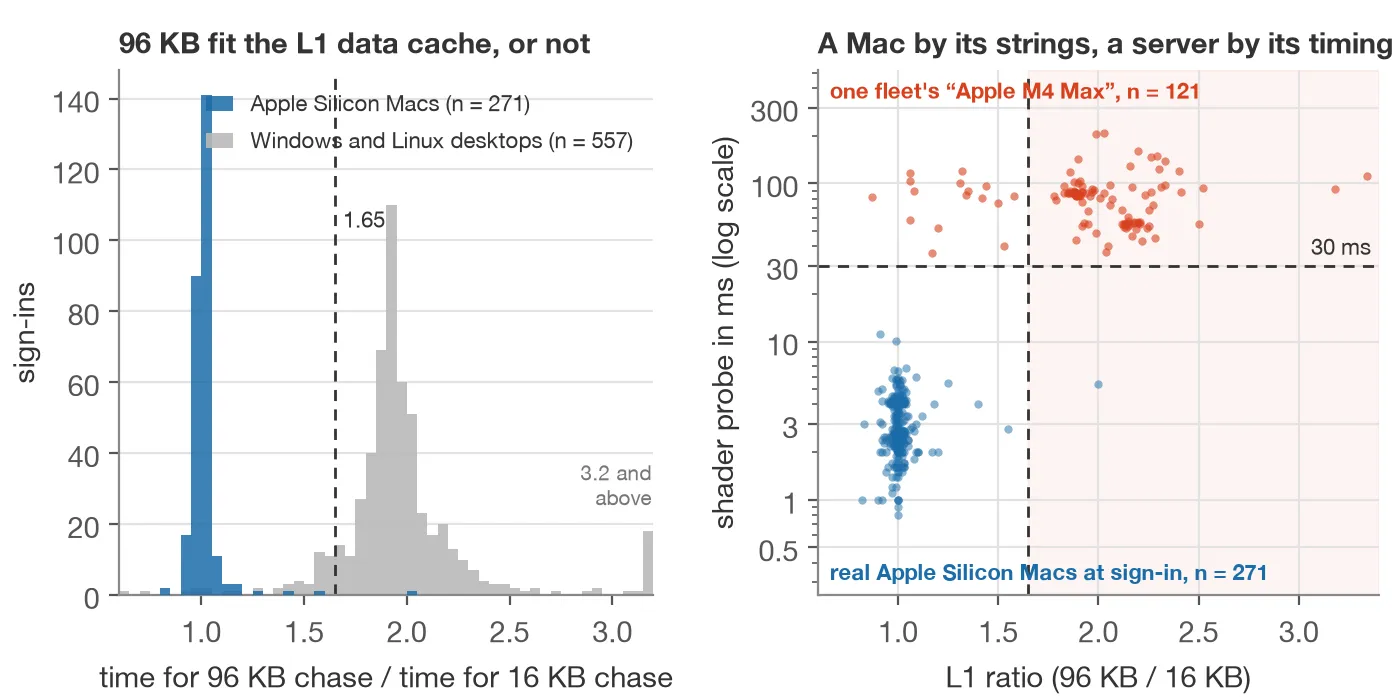
So I shipped it: a Mac by User-Agent and renderer string with a ratio of 1.65 or more was flagged. Then a real Mac with an M3 signed up and measured 2.0.
The trap: one Mac has two kinds of core
$ sysctl hw.perflevel0.l1dcachesize hw.perflevel1.l1dcachesize
hw.perflevel0.l1dcachesize: 131072
hw.perflevel1.l1dcachesize: 65536
Apple Silicon has two tiers of cores, and the second tier has 64 KB of L1 data cache. 96 KB do not fit there either. macOS puts work on the second tier when it considers it unimportant. taskpolicy -b -p <pid> declares a running process unimportant, so the effect can be switched on and off from a terminal while a page measures itself:
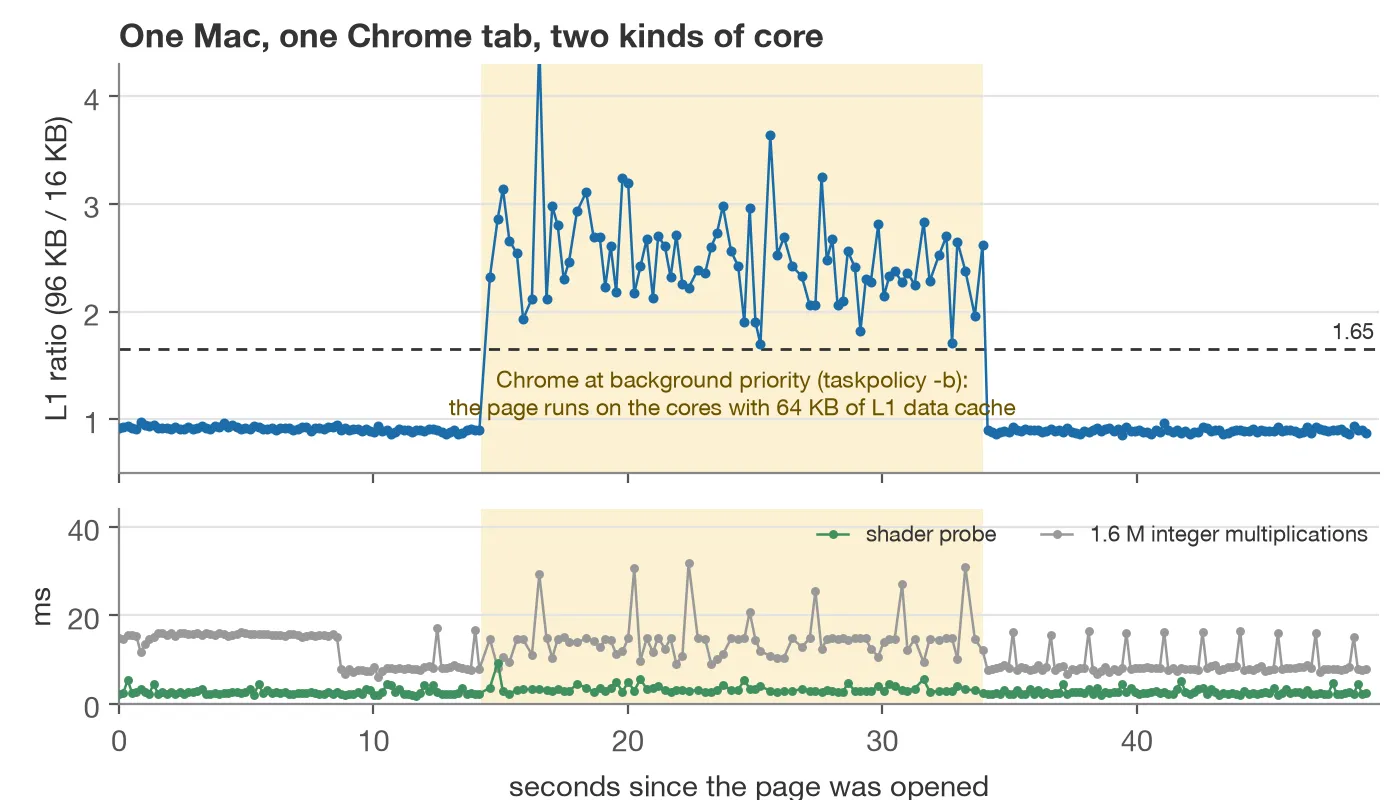
It does not take a terminal. When I repeated the experiment and another window happened to cover the tab, document.visibilityState turned to hidden and the readings went from 0.9 to between 1.9 and 3.3 on their own: Chrome lowers the priority of tabs that nobody can see, and macOS then moves them to the second tier. My own Safari produced a 2.64 on the live site while I was testing v12.
A cache ratio alone therefore cannot tell an x86 server from a Mac that is saving energy. It needs a partner that does not depend on which core the page happens to run on.
Probe 3: the sign of a NaN
const f = new Float32Array(1);
f[0] = Infinity;
f[0] = f[0] - f[0];                          // an invalid operation, computed at run time
const fpu = new Uint8Array(f.buffer)[3] >> 7;   // 1 on x86, 0 on ARM
IEEE 754 does not say which NaN an invalid operation such as ∞ − ∞ has to produce, and the two families chose differently: x86 sets the sign bit of its default NaN (0xFFC00000), ARM clears it (0x7FC00000). This is old knowledge. It is the reason why WebAssembly had to declare the sign of a NaN nondeterministic [12], and SpiderMonkey's source has a comment about it [13]. JavaScript hides the bit, as all NaNs are one value there, but a typed array stores the bytes that the FPU produced. The value has to come out of a computation at run time: the literal NaN, and a 0/0 that the engine folds while compiling, are the engine's NaN and not the CPU's.
| where | NaN sign |
|---|---|
Chrome 157, Firefox 159, Safari 26.6 and jsc on the M5 Max |
0 |
| Chrome 156 on a Samsung phone | 0 |
| Node on the AMD EPYC and on the Intel Xeon | 1 |
| Firefox as an x86-64 binary under Rosetta 2, on the M5 Max | 1 |
jsc as an x86-64 binary under Rosetta 2, on the M5 Max |
1 |
The last two rows are the interesting ones. Rosetta translates x86 code and has to answer like an x86 FPU, so it does. But the same Firefox under Rosetta measures an L1 ratio of 0.92, because the cache is still Apple's.
That gives the rule in v12: the signal fires for a browser that claims to be an Apple Silicon Mac, has x86's NaN and an L1 ratio of 1.65 or more. A Mac on its small cores has ARM's NaN. A Mac that runs an Intel build of its browser has x86's NaN and Apple's cache. Only something that is neither has both.
What did not survive
The first version of the hardware probes went live on 30 October with four signals, all scored, none measured. Two of them are gone, together with the benchmark behind them:
- Worker scaling. Four Workers compute in parallel; if that takes 2.6 times as long as one Worker alone while the browser claims six or more cores, the cores are not there. That was the idea. It fired for 3.3% of paying customers: machines with two tiers of cores, phones, and Firefox, whose 1 ms clock turns a short measurement into a lottery.
- Worker jitter. Sixteen message round trips to a Worker; if they take more than 12 ms, or if the CPU loop stalls in the middle, a hypervisor is stealing time. That was the idea. It fired for 25.5% of paying customers. What it measured was the page's own start-up work, which competes with the Worker for the main thread.
Two of the six differential operations in [7] are Worker operations. The authors tested 18 clean environments. I tested the mess that real browsers are in while a page loads, and there these two do not separate anything.
The time of the CPU loop on its own is not a signal either. I wanted to read a CPU class from it. It ranges from 4 to 31 ms among 270 Apple Silicon Macs alone.
Part III: Real traffic
The hardware signals, before and after
The table counts the snapshots in which each signal fired, with the weights and rules of the first version, and what the rules of v12 make of the same snapshots.
| signal (weight) | paying, 153 | accepted, 1,086 | refused, 296 | what fired it | in v12 |
|---|---|---|---|---|---|
| Worker jitter (12) | 39 (25.5%) | 328 (30.2%) | 158 (53.4%) | the page's own start-up work | removed |
| Worker scaling (25) | 5 (3.3%) | 26 (2.4%) | 22 (7.4%) | two tiers of cores, phones, 1 ms clocks | removed |
| pointer press without pressure (30) | 7 (4.6%) | 55 (5.1%) | 27 (9.1%) | 63 of 64 iPhone and iPad sessions with a tap | a mouse only |
| window without browser chrome (25) | 1 (0.7%) | 22 (2.0%) | 5 (1.7%) | page zoom, WebKit views inside other apps | 0 / 5 / 3 |
| shader time (25) | 0 | 17 (1.6%) | 157 (53.0%) | old and integrated graphics, a phone | 0 / 1 / 152 |
| L1 ratio on a claimed Mac (25) | 0 | 1 (0.1%) | 0 | a real M3 | needs x86's NaN too |
The two rows in the middle are not side channels, but they went live in the same release and failed in the same way, so they belong here. The pointer signal looked for a trusted pointerdown with a pressure of 0, which is what CDP's Input.dispatchMouseEvent produces. It is also what every finger on an iPhone produces. It now counts a mouse only, and with that it is specific to Puppeteer: Playwright sends its presses with a force of 0.5. The window signal compared outerHeight with innerHeight to find windows without a toolbar. A page that is zoomed out has a viewport larger than its window. Of its 28 hits, 11 were zoomed pages and 7 were WebKit views with a Safari User-Agent.
With no hit among 153 snapshots of paying accounts, the one-sided 95% bound for the false positive rate of the shader signal is 1 − 0.051/153, which is 1.9%. That is all that 153 snapshots can promise. Over all 912 sign-ins of customers and other accepted users whose browser names a hardware GPU and reports no touch screen, it has one hit, the automated browser at 631 ms.
Two of the redesigned signals, the mouse press and the NaN, need values that the old collector did not send, so they cannot fire on old snapshots. Read the v12 column as a lower bound.
Every signal as one point
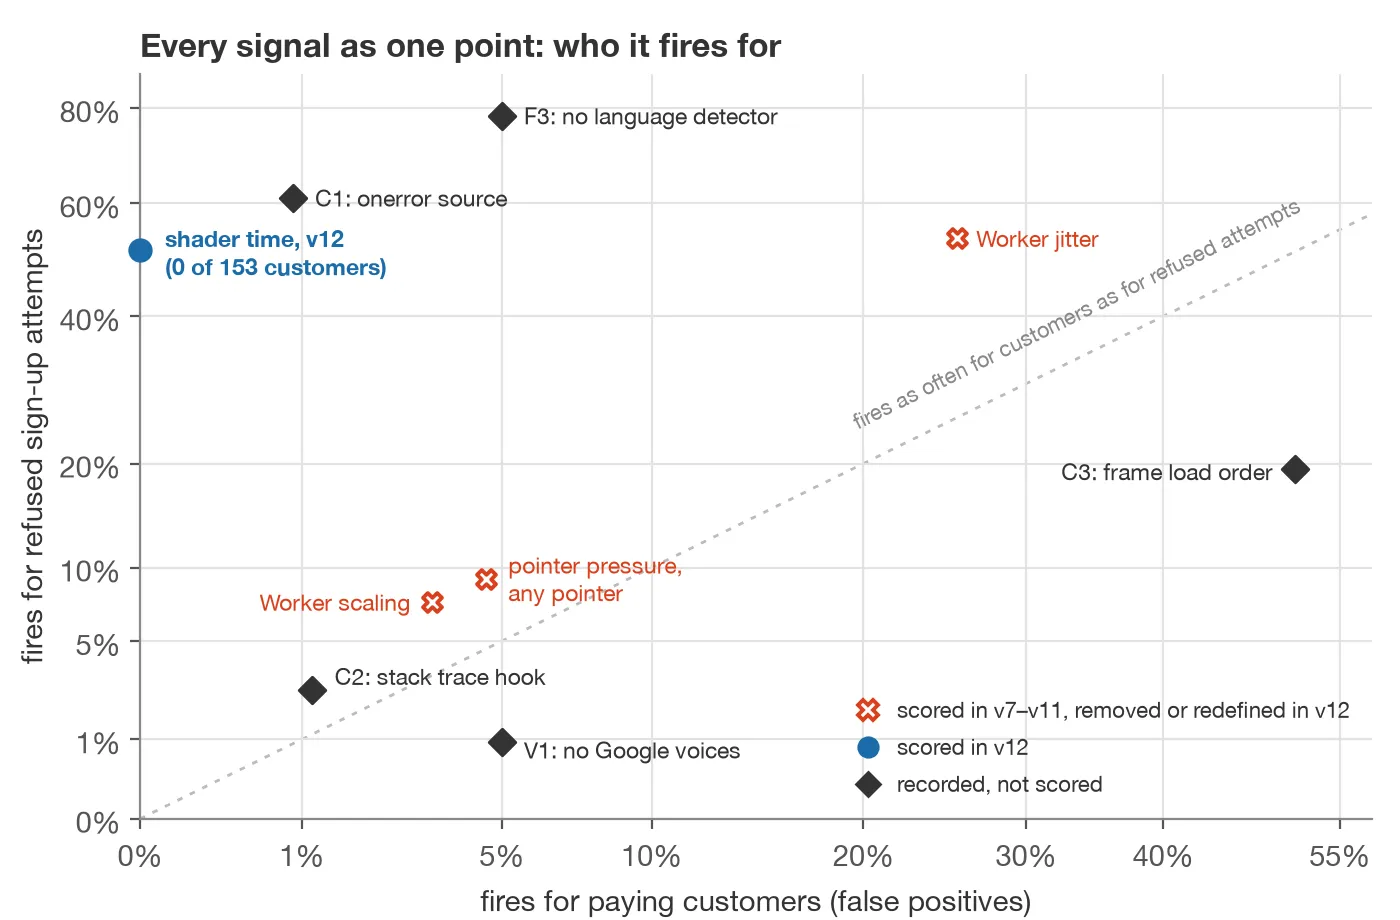
| signal | paying | accepted | refused |
|---|---|---|---|
C1, onerror source |
1 of 112 | 13 of 821 (1.6%) | 160 of 262 (61.1%) |
| F3, no language detector | 2 of 40 | 12 of 279 (4.3%) | 83 of 106 (78.3%) |
| F2, no Widevine | 0 of 1 | 0 of 31 | 11 of 17 |
| C2, stack trace hook | 1 of 88 | 7 of 636 (1.1%) | 5 of 191 (2.6%) |
| V1, no Google voices | 2 of 40 | 13 of 277 (4.7%) | 1 of 106 (0.9%) |
| C3, frame load order | 26 of 51 | 148 of 330 (44.8%) | 26 of 134 (19.4%) |
| H3, SwiftShader despite the flag | 1 of 26 | 2 of 593 | 1 of 207 |
| H2, no pointing device | 0 of 23 | 0 of 447 | 2 of 182 |
| S1, S2, S4 (headless shell) | 0 | 10 hits | 5 hits |
| S6, S7, F4, H4, 800×600 screen | 0 | 0 | 0 |
C1 is the best signal of Part I, and it has been since September: one snapshot of a paying account in 112, 61% of the refused attempts. And that one snapshot is no mistake. It is a refused login attempt with navigator.webdriver set, and it triggers C2 as well, in the page and in a Worker: an automation client on a customer's account, whoever ran it.
F3 is the surprise. The missing language detector, a side effect of a feature that Puppeteer and Playwright switch off for unrelated reasons, fires for 78% of the refused attempts in which it was measured. Its 2 of 40 among paying accounts include that same scripted login, and 40 snapshots are too few to give the signal a weight.
C3 is the lesson. The frame whose message overtakes its load event, stable in every lab run on two operating systems and with both real tools, fires for half of my paying customers and for a fifth of the refused attempts. In the field it is worse than a coin. The code comment already said that it is a race. The lab never showed it, because a WPT server on localhost and an idle test page are no race at all. I do not know yet what tips it on a real login page. It stays recorded and gets no weight, and it is the reason why the last box in Figure 2 exists.
V1 points the wrong way. The fleets that sign up here have their Google voices, and about one in twenty accepted sign-ins does not.
The headless shell signals found nobody. They did not fire for customers, which is good, and hardly for anyone else, which says that the shell is not what people use to sign up at ipapi.is.
Verdicts
Replaying two classifiers over the same snapshots, the one from before this work (I call it v11, after its collector schema) and v12:
| v11: human / suspicious / automated | v12: human / suspicious / automated | |
|---|---|---|
| paying, 153 | 138 / 12 / 3 | 149 / 3 / 1 |
| accepted, 1,086 | 891 / 186 / 9 | 1,021 / 61 / 4 |
| refused, 296 | 66 / 172 / 58 | 99 / 177 / 20 |
Fifteen snapshots of paying accounts under suspicion became four, and no snapshot is automated in v12 that was not in v11. The one that is left with that verdict is the scripted login from above, and the classifier is right about it. The last row is the price: 38 refused attempts are no longer called automated. 26 of them typed and moved a pointer like people, and I believe the new verdict more than the old one. Twelve belong to a fleet, and for those the classifier alone has become weaker. Many refused attempts look human to it, in either version, because the service also looks at things that no browser signal shows.
On botstop.io, 647 of the 1,102 checks came out suspicious or automated in v11 and 265 in v12. 511 checks changed their verdict.
Six bots in the lab
Detection in the lab is the easy half, but it shows which signals carry which stack. All six run Chrome for Testing 151 on the M5 Max against a local copy of botstop.io v12.0.
| stack | score | scored signals that fired | recorded |
|---|---|---|---|
| Puppeteer, headless, defaults | 100 | navigator.webdriver, headless UA, window without chrome, 800×600 screen |
C1, C2, C3, F1 |
| Puppeteer on SwiftShader, clicks and fills a hidden field | 100 | the above, honeypot, mouse press without pressure, SwiftShader, H3 | C1, C2, C3, F1 |
| Playwright, headless, clicks | 100 | navigator.webdriver, headless UA, window without chrome |
C1, C2, C3, F1 |
stealth patches: no webdriver, clean UA, patched navigator |
83 | Worker disagrees with the page (twice), patched native function, window without chrome, 800×600 screen | C1, C2, C3, F1, F4, default permissions |
| the same, WebGL string says "Apple M3 Max", rendering on SwiftShader | 90 | Worker disagrees, window without chrome, shader time, 800×600 screen | C1, C2, C3, F1, F4 |
| the same, simulating an x86 host, synthetic input | 100 | all input synthetic, window without chrome, NaN sign and L1 ratio, 800×600 screen | C1, C2, C3, F1, F4 |
The fifth row is Figure 1b. The last row cheats in the open. I have no x86 machine that claims to be a Mac, so the test hooks performance.now() and Float32Array to make the M5 Max measure like one. That also shows the weak spot of everything in Part II, and I come back to it in the limitations.
Two fleets
The RTX fleet. 153 of the refused sign-up attempts share a profile: a Linux User-Agent with Chrome 146, a GeForce RTX card of the 30, 40 or 50 series in the WebGL string, and a WebGPU adapter that agrees with it down to the architecture name (ampere, lovelace, blackwell). Each has 8 cores. All of them type and move a pointer. That is careful work. The shader probe takes more than 100 ms in 150 of the 153, with a median of 186 ms. The 168 real GeForce cards among the accepted sign-ins have a median of 2.2 ms. The median L1 ratio is 2.05, as on any x86 machine. C1 fires in 151 of the 153, so a client sits on the Runtime domain, and F3 fires in all 80 in which it was measured. C2 fires in none of the 108 in which it was measured, although C1 and C2 come from the same command in the lab. I cannot explain that yet.
The M4 Max fleet. botstop.io has a regular: a fleet that arrives in bursts and presents three hardware profiles. One is a MacBook Pro with an M4 Max: 16 cores, a 1512×982 screen, 210 speech voices, a WebGPU adapter from Apple with metal-3, and client hints that say ARM. All of that is identical in 121 visits. Only the language and the time zone change with the exit address. C1 never fires, so this fleet stays away from Runtime.enable. F3 fires in 101 of the 113 visits in which it was measured.
And the hardware (Figure 4, right): the shader takes between 36 and 208 ms, with a median of 85 ms, more than 30 ms in every one of the 121 visits. The L1 ratio is 1.65 or more in 105 of them. Among 271 real Apple Silicon Macs, no shader took more than 11.1 ms, and one had such a ratio. One real M4 Max came by botstop.io in the same days, with 14 cores and another screen. It measured 1.3 ms and 0.94.
The same fleet shows the limit of the method. Its second profile is a Windows PC with a Quadro P1000, and there the shader takes 46 to 83 ms in four of five visits. That is software rendering on a fast CPU, and it stays under the 100 ms that an old Intel chip forces me to allow: v12 calls 179 of those 190 visits human. v11 called 185 of them suspicious, with the limit that was also wrong for 16 real machines. The third profile is an Android phone, and phones are not judged at all. The fix is not a lower limit. It is a reference time per claimed GPU model, the way Apple Silicon has one now, and that needs more data than eleven days.
I cannot report yet what the NaN says about this fleet. Version 12.0 went live a few hours ago, and since then botstop.io has seen my own browsers and a Samsung phone, ARM by its NaN. I will add the result here when the fleet has come by.
Versions
One thing I should have built on the first day: a version that is stored with every verdict. The work described here changed the verdict of 46% of all checks on botstop.io. Without a version, a link to a check from October would silently show a different result today, and nobody could say which rules produced which number.
The version has two parts, the schema of the collector (what is measured) and a revision of the classifier (how it is judged): 12.0. Every check keeps the version it was made with. A permalink to an older check says what its version scored and what the current one makes of the same data.
Limitations
- The labels. "Paying" is my only clean class, and it has 153 snapshots. "Refused" is not independent of the classifier. All detection rates are for the fleets that happened to visit in these eleven days.
- The population. A developer audience, one site. Old office PCs, kiosks and smart TVs are missing, and 71 ms may not be the slowest honest GPU in the world.
- The lab. S6, S7 and F1 to F4 are confirmed on macOS only. No signal has a Windows baseline from the lab, and Windows is where most real users are. Edge, Brave and Opera are unmeasured for the headless shell signals. Selenium and the tools that avoid
Runtime.enablehave not been run through hHunter. They should pass C1 and C2 by construction. - An attached client is not a bot. DevTools and AI agents in a person's own browser trigger C1 to C3. That is why they carry no weight alone.
- Everything in Part II can be hooked. The probes read a clock and a typed array, and a page-level script can replace both, as my own sixth test does. Such hooks have to hide from the checks for patched native functions and from a Worker that has a clock of its own, and the NaN probe would be harder to reach from WebAssembly. But an anti-detect browser that patches the clock in C++ can pass. The side channels raise the price. They do not close the door.
- ARM servers. Arm's Neoverse N1, the core of the first large ARM cloud servers, has 64 KB of L1 data cache and ARM's NaN. A fleet on such machines looks like a Mac on its small cores to the cache rule. The shader does not care which CPU fails to be a GPU.
- Rosetta on small cores. An Intel build of a browser, on an Apple Silicon Mac, in a background tab, has x86's NaN and a ratio of 2. I have not seen it. It will happen.
- Touch screens. A device that reports a touch screen is not judged by the shader probe at all. That is one more claim a fleet can make.
- Cost. About 50 ms of main thread per page view on a fast laptop, more on slow machines. That is paid by everyone, to measure a few.
Conclusion
Three things I take away from this.
A signal is a hypothesis until it has been counted on customers. Three runs on one server gave 152 findings, eight more left 13, and real traffic turned the one I liked best into a coin flip. The weight 0 is the most useful weight in the classifier.
What a browser says and what it does can be told apart, cheaply. One shader separates a fleet's "Apple M4 Max" from the real thing in 121 of 121 visits, with a clock that only knows tenths of a millisecond. Two loops and one subtraction are there for the day the shader is not enough.
Detection that depends on being secret is rented, not owned. Every signal in Part I is one launch switch or one protocol command away from being gone, and some of the tools already took that step. The probes in Part II can be defeated too, but the cheapest way to pass them is to buy the hardware one claims to have, and that is a price I am happy to let a fleet pay.
If you write bots or detectors: botstop.io shows all of this for your own browser, signal by signal, with the measured values. If you get a stack past it, or it calls your real browser a bot, I would like to hear about it in the comments.
References
- Y. Oren, V. P. Kemerlis, S. Sethumadhavan, A. D. Keromytis: The Spy in the Sandbox: Practical Cache Attacks in JavaScript and their Implications. ACM CCS 2015.
- M. Schwarz, C. Maurice, D. Gruss, S. Mangard: Fantastic Timers and Where to Find Them: High-Resolution Microarchitectural Attacks in JavaScript. Financial Cryptography 2017.
- MDN Web Docs: Performance: now() method, section "Security requirements".
- The web-platform-tests project, github.com/web-platform-tests/wpt.
- Rebrowser: How to fix Runtime.Enable CDP detection of Puppeteer, Playwright and other automation libraries? and rebrowser-bot-detector.
- A. Vastel: Why a classic CDP bot detection signal suddenly stopped working (and nobody noticed). Castle blog, August 2025.
- G. Ho, D. Boneh, L. Ballard, N. Provos: Tick Tock: Building Browser Red Pills from Timing Side Channels. USENIX WOOT 2014.
- T. Laor, N. Mehanna, A. Durey, V. Dyadyuk, P. Laperdrix, C. Maurice, Y. Oren, R. Rouvoy, W. Rudametkin, Y. Yarom: DrawnApart: A Device Identification Technique based on Remote GPU Fingerprinting. NDSS 2022.
- L. Trampert, C. Rossow, M. Schwarz: Browser-based CPU Fingerprinting. ESORICS 2022.
- M. Schwarz, F. Lackner, D. Gruss: JavaScript Template Attacks: Automatically Inferring Host Information for Targeted Exploits. NDSS 2019.
- E. Bursztein, A. Malyshev, T. Pietraszek, K. Thomas: Picasso: Lightweight Device Class Fingerprinting for Web Clients. SPSM 2016.
- WebAssembly design: Nondeterminism in WebAssembly and issue 619 ("x86 uses 1, ARM uses 0").
- SpiderMonkey: js/public/Value.h, the comment on the canonical hardware NaN.